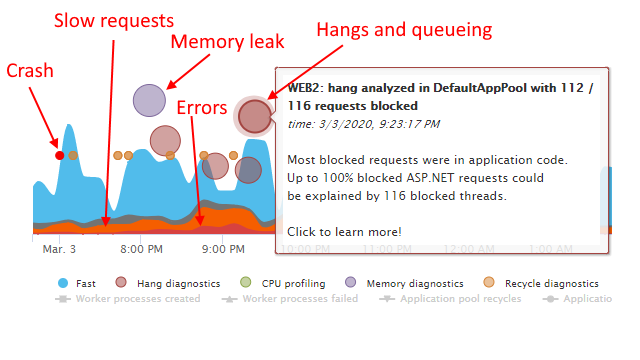
Monitoring IIS performance is an important activity that theoretically helps you keep your website running.
There are dozens of tools that promise to help you do it.
Whether you are using these IIS monitoring tools, or doing it old school with performance counters and IIS logs, your process probably boils down to watching tens of well-known counters and metrics like connections, requests per second, average latency, various numbers of threads, application pool queue length, etc.
In practice though, it’s probably a big waste of your time.
Most of the monitoring activities, such as tracking changes in performance counters produces no useful action (and worse, can send you on a wild goose chase).
This is also true for most of the IIS performance tuning advice online … it usually produces little to no impact on actual production website performance.
At the same time, when your website experiences performance problems, these metrics cannot give you enough information on WHAT is happening and most importantly WHY it’s happening and how you can fix it.
Think about it. What performance counters/metrics do you use to figure out what is causing these typical performance issues:
- Website hangs
- Application pool queueing and 503 responses
- CPU overloads
- Memory leaks
- Crashes
- Occasionally slow website requests
The sad truth is that when these things happen, most people just restart the application pool and hope the problem goes away. Of course, it often does not.
So, is there a better way to monitor IIS websites to skip the noise, but actually resolve performance issues when they happen?
An IIS monitoring model that actually works
During 10 years of helping 30,000+ IIS sites solve performance problems with LeanSentry, we’ve set out to answer this very question.
In this guide, we’ll show you how to monitor your IIS websites so you can resolve issues faster, without spending time “monitoring” things that don’t matter.
Most importantly, we’ll provide you with a simple, actionable IIS monitoring model that helps you:
- Recognize/identify each class of performance issues that affect your website health … and how to diagnose them to code whenever they happen.
- How to do this in production (because that’s where they happen!)
- And do it without introducing production overhead.
Before we do this, let’s take a brief look at what actually determines your production website performance. This understanding will enable you to take the best advantage of the monitoring and tuning approach we’ll outline below.
What really defines your IIS website performance
We begin with the idea that fundamentally the IIS web server and ASP.NET framework are tuned to deliver higher performance than you can ever realistically achieve with any real web application workload.
Any real web application will introduce bottlenecks that will negatively affect the website performance. The common types of bottlenecks include thread pool exhaustion, garbage collection overhead, lock contention, CPU and memory overloads.
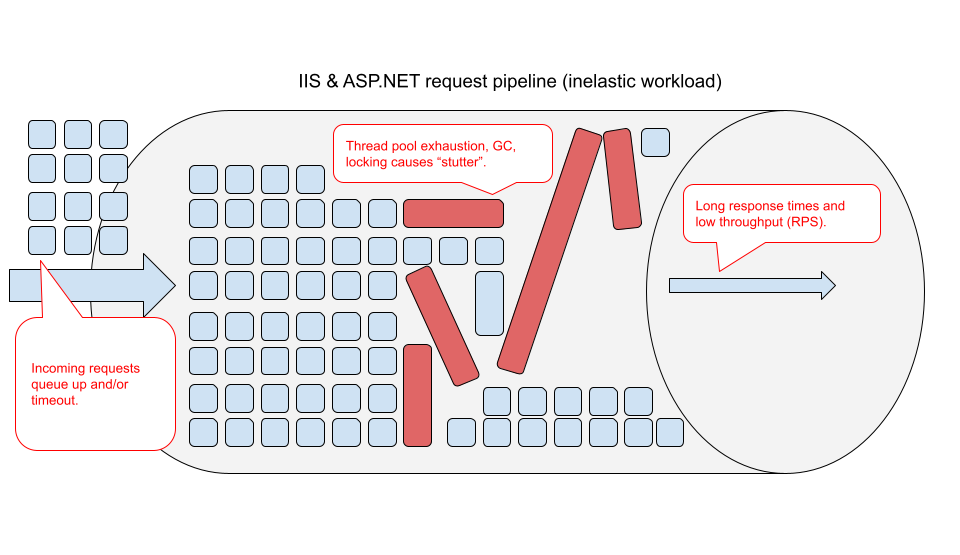
So, to improve and maintain great performance, we simply need to correctly detect these issues when they happen, and resolve them to unlock the “smoothest” performance that’s already baked into the system.
(For a further explanation on inelastic application workloads, and the issues that commonly prevent your IIS and ASP.NET website from maintaining good performance under load, see the discussion in our IIS Worker Process High CPU usage guide.)
This assumes of course that we are able to identify and diagnose these issues correctly. This is where typical IIS monitoring chokes, because the tools rely on YOU to figure out what the issues are. Of course, doing this in production is very hard.
Thankfully, this is exactly where LeanSentry shines, by detecting and diagnosing the issues for you. So, your main job becomes correctly prioritizing and addressing the important issues using the provided diagnostics.
Let’s dig into the model that helps you prioritize and target the right issues to get your website to it’s best health.
A simple model for improving IIS website performance
When a typical customer first starts using LeanSentry to monitor and diagnose their IIS website, they are likely to have dozens, or possibly hundreds, of such issues.
It’s impractical to fix them all.

Instead, what we need to do is sort the issues based on the impact they have on website stability and performance, and resolve the biggest issues to unlock immediate improvements to site health.
Then, depending on the available time and goals, we can systematically clean up the rest in priority order.
To do this, we’ve developed use a simple model we call the “performance onion”:
The performance onion: a simple prioritization model for improving IIS website performance
The goal of this model is to classify performance issues affecting IIS websites, and prioritize them into actionable tiers based on their impact to your IIS website health.
This model is designed to reduce a large volume of non-actionable “monitoring” data into an immediately actionable set of specific issues that can be clearly identified, diagnosed, and measurably resolved.
As you work through, or “peal” each layer of the onion, your website becomes increasingly stable, fast, and more efficient/lower cost to run. At the final stage, you end up with an optimal website that you can easily detect & resolve regressions in in order to effectively maintain the clean state.
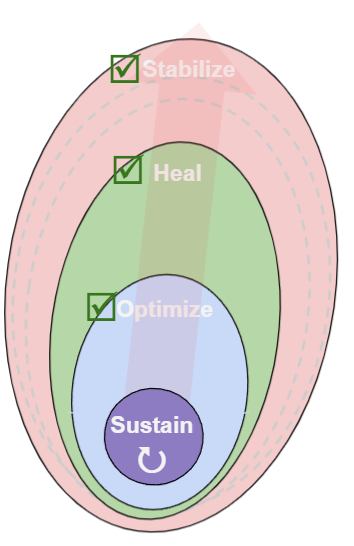
The model consists of the following progressive phases:
- Stabilize. The initial phase, during which you identify and fix major issues that have severe performance or stability impact on your website. These issues are the reason why customers first come to LeanSentry. They include website hangs, crashes, and severe CPU or memory overloads.
- Heal. Now that you are clear of major stability issues, proactively address the biggest causes of errors and slow requests that directly reduce your website’s satisfaction score.
- Optimize. Identify and seize opportunities to make your application more efficient, to improve avg. throughput, improve scalability and lower hosting costs by reducing memory and CPU usage.
- Sustain*. Maintain the optimal/clean state by addressing any performance regressions.
(I linked each phase above to the detailed section in this guide that shows how to do the necessary work using LeanSentry diagnostics)
*Note that the “performance onion” usually re-grows over time. This happens simply because code changes and new features often introduce additional bottlenecks, as do over-time increases and shifts in usage.
However, once you are in the clean state, detecting these regressions becomes easy. You can keep your website at peak performance by quickly responding to any regression (and it helps that regressions become much more obvious on top of a clean performance state).
Next, we’ll go through each step in the model step by step to see how you can use your LeanSentry data to proactively improve your website performance.
Stabilize (step 1)
In this phase, our goal is to address major issues that cause outages or severe performance impact.
You are usually aware of these issues because they cause downtime, or critically impact your user experience. The “fallout” of (most of) these issues is usually seen by all your IIS monitoring tools.
Unfortunately, the root cause of these issues is much harder to determine with regular monitoring. But, if you have LeanSentry deployed on the server, it will detect, classify, and automatically diagnose these issues down to their code-level root cause.

In practice, there are only a few issues in this category: Hangs, CPU overloads, and Crashes.
(Note: there is no top level metric that can adequately measure the presence of severe issues, which is why you simply make sure that your website is free of these issues to complete this phase.)
Hangs
Your website appears to hang, with high or sometimes very low CPU usage. This can be caused by application code deadlocking, or by a number of resources inside your application being exhausted (e.g. thread pool exhaustion).
IIS monitoring tools will show outward symptoms of hangs like this:
- The website stops serving requests.
- Requests are shown queued in the “Execute Request Handler” stage.
- Many/most requests are taking 30-60 seconds or longer to return responses.
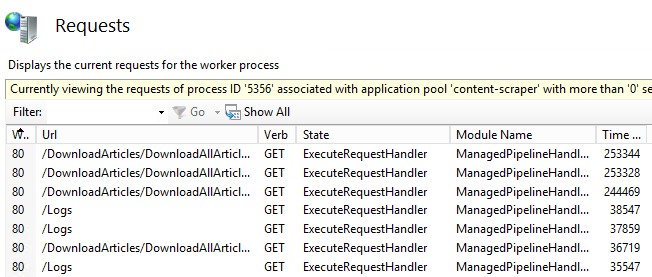
LeanSentry goes further to identify and diagnose the causes of IIS and ASP.NET hangs.
When a hang takes place, LeanSentry will alert you about severe hangs, and include a link to a diagnostic report which will identify the cause of the hang and the application code triggering it. These causes will usually include:
- Thread pool exhaustion.
- Lock contention.
- Deadlocks.
- Slow external services.
- CPU hotspots and Garbage collection overhead.
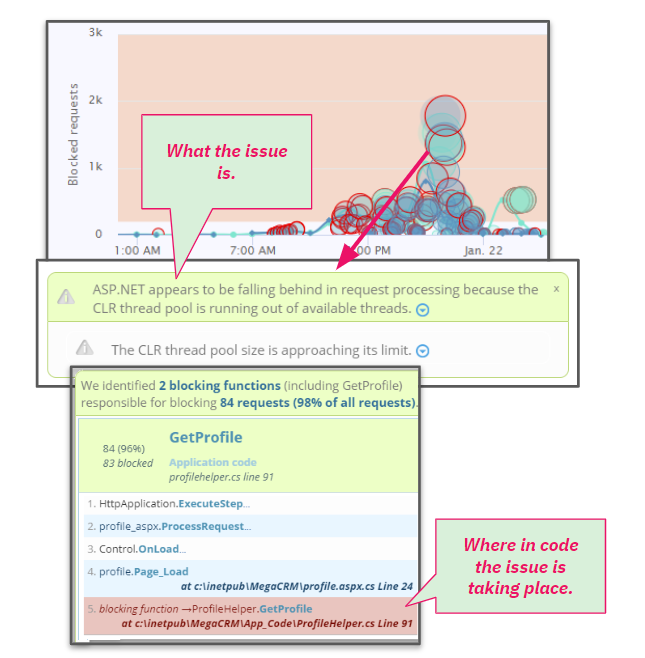
Goal: We strongly recommend addressing all significant hangs in your website in the stabilize phase. Hangs usually signify the presence of bottlenecks that will return time and time again, and can take down your otherwise high performance website. Thankfully, hangs are usually caused by 1-3 causes at any given time, so once you work through them, you should be in good shape for some time.
How to do it:
- Select your website and go to the Hang diagnostics tab.
- Review and fix any hang with more than 10 blocked requests.
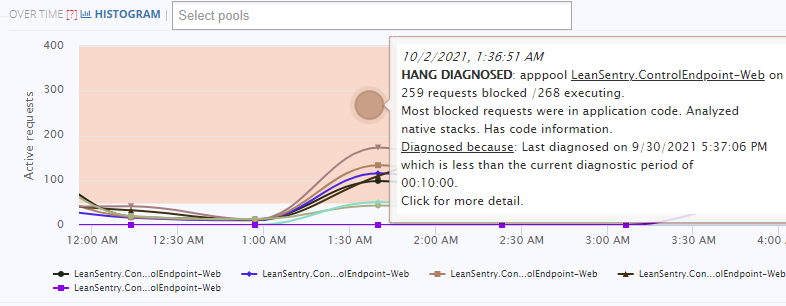
For the detailed how-to on identifying and fixing hangs, see our Diagnose website hangs guide.
CPU overloads
A CPU overload is another fairly obvious issue, which usually involves your server experiencing 90% or higher CPU usage.
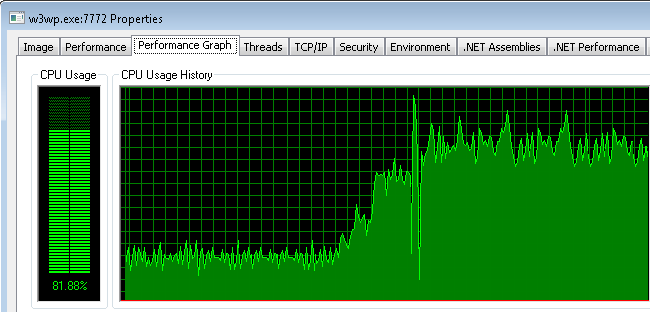
The typical result of a CPU overload is a 503 Queue Full outage, where most/all of the requests to your website begin to fail with 503 responses.
(We explain the causes of application pool queueing in our IIS thread pool guide.)

In some cases, it is possible to experience severe performance degradation (normally fast requests taking a very long time to return) even at moderate CPU usage levels. This can be caused by an inelastic application workload, or the inability of the application to maintain adequate performance at moderate CPU usage (also known as a high CPU hang), or concurrency overload caused by too many active threads or tasks. The latter is often seen as a high “Processor queue” and can take place even when your server has moderate % processor time.
LeanSentry will automatically detect CPU overloads, and diagnose them to determine the code causing CPU usage.

Goal: Make sure your application has no 503 outages, and your server never enters an overloaded state (CPU >= 90%, Processor queue >=10). You can work on further CPU optimizations to improve performance/reduce costs in the Optimize phase.
How to do it:
- Select your website
- Check the Errors tab and make sure you don’t have any 503 Queue Full errors.
- Go to the CPU Diagnostics tab.
- Click “histogram” on the timeline and select the moderate-high range of CPU usage, e.g. 40%-100%.
- Review the high CPU reports with server utilization 80% and above, and optimize the code causing the overload.
See our Diagnose w3wp.exe high CPU usage guide for a full walkthrough on diagnosing and resolving CPU overloads and high CPU usage in your applications.
Crashes
A crash is an abrupt failure of the IIS worker process, typically due to a critical code failure like a stack overflow, or an unhandled exception. These failures are NOT like request errors that abort a single request, but a complete process failure, which causes ALL requests in the worker process to be terminated.
Crashes can have a severe impact on your website availability:
- During the crash, no try/finally code executes, and so a crash also introduces the potential for data corruption or leaving remote locks unreleased. This can cause the application to enter a persistent failure state.
- If your worker process crashes too many times in a row, IIS will disable your application pool (this feature is called Rapid Fail Protection). As a result, your website will become permanently down on the server in question until the application pool is manually re-started.
Even worse, crashes are often “invisible” to IIS monitoring tools and most APM tools, because (a) no IIS errors are logged for aborted requests and (b) APM tools loaded into your worker process terminate with it.
LeanSentry is external to your worker process, and will detect and diagnose crashes down to code, so you can fix them. We strongly recommend fixing all crashes as soon as possible as part of your stabilization efforts.
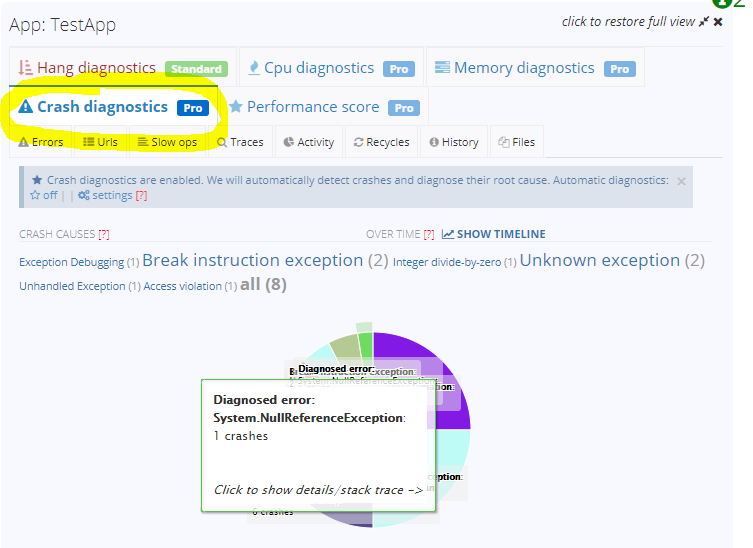
Goal: Your website should have zero 503 AppOffline errors, and 0 crashes.
How to do it:
- Select your website and go to the “Crash diagnostics” tab.
- If you have crashes, go through the crash reports (“Reports” sub-tab on the bottom) and fix each crash cause.
- If you have crashes outside of your application code, you can use your S2 support to get more help from our team.
To identify and fix crashes using LeanSentry diagnostics, including loading the crashes into Visual Studio for a full inspection, see Debug production crashes with LeanSentry.
Memory and recycling issues
Some applications may also experience memory overloads and excessive recycling that can qualify as severe due to loss of in-process state or application long warmup times. Memory and recycling go hand-in hand because most websites use memory-based recycling to deal with memory leaks.
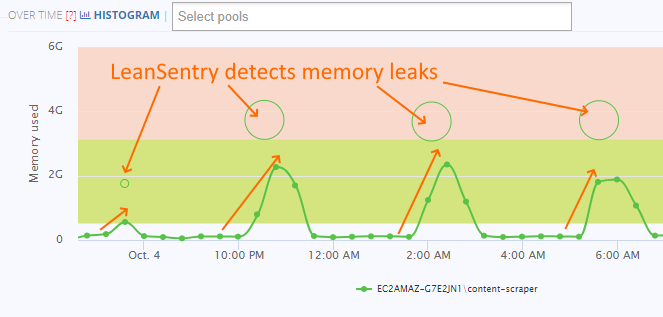
We cover memory optimization and recycle optimization in the Optimize phase below but you can prioritize it into the Stabilize phase if your memory issues have severe impact.
You can learn more about resolving memory leaks in our Diagnose w3wp memory usage guide, and learn how to optimize your recycling with a resilient warmup strategy.
Heal (Step 2)
Once you address the critical issues in the Stabilize phase, your website should be free of severe incidents that demand urgent intervention.
However, most applications will still experience a steady flow of errors and slow requests that negatively impact your user experience.
In the Heal phase, you can proactively work through the slow requests and errors, tackling the issues that cause the biggest impact.
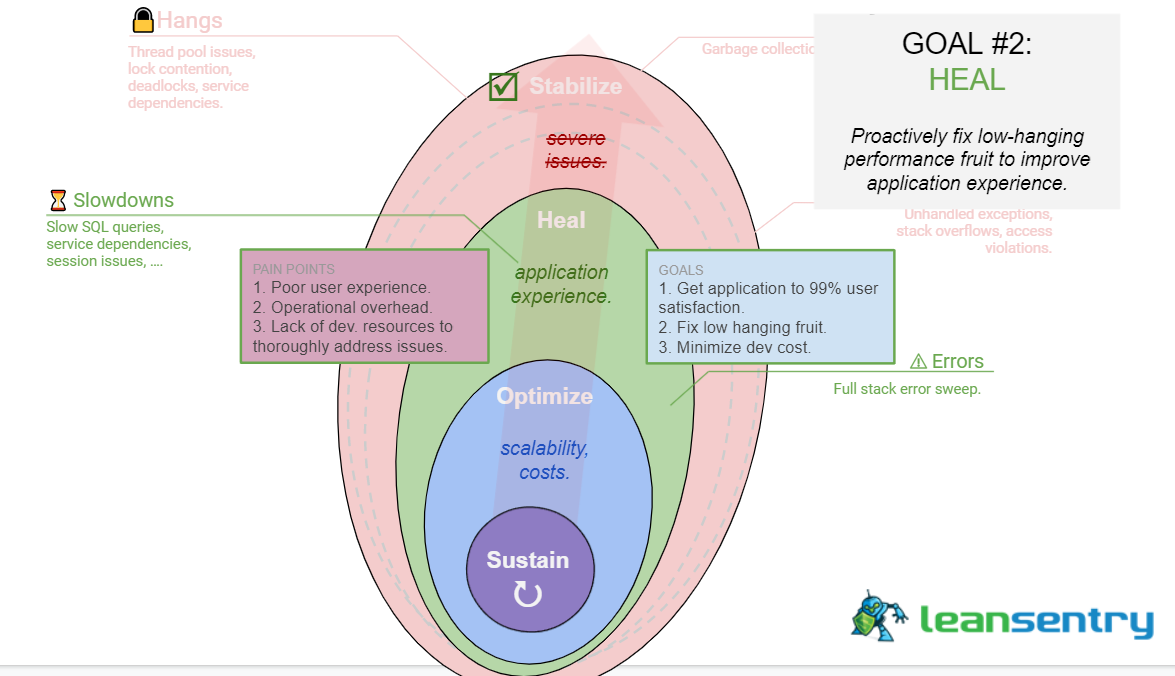
The Heal phase: improve quality of service by fixing top errors, and top causes of slow requests.
The best way to track your progress here is to use the Satisfaction score metric as a top-level measurement of your website’s quality of service. You can read the detailed discussion of monitoring the website’s quality of service via the satisfaction score in our IIS log analysis guide.
That said, the LeanSentry dashboard tracks this score for you, and breaks it down into the errors and slow request components.

LeanSentry tracks slow and failed requests, and computes your website’s total satisfaction score which tracks your user’s experience.
Goals:
- Get your website to 99% satisfaction to get an A, or 99.9% for an A+ if you are an overachiever.
- If your website has particularly important URLs, like /Checkout, that are critical to your business, get each important URL’s satisfaction score to 99%.
How to do it:
- Fix errors in the “Errors” tab for the website or specific URLs.
- Optimize top causes of slow requests, in the “Slow operations” tab for the website or specific URLs.
Each slowdown and each error that you fix during this phase will improve your satisfaction score:
Fix the errors that cause the most numbers of failed requests
To do this in LeanSentry, select your website head to the Errors tab. You can then see a combined list of all errors causing failed requests across your entire web stack, including IIS, ASP.NET, your app, Http.sys, and so forth.
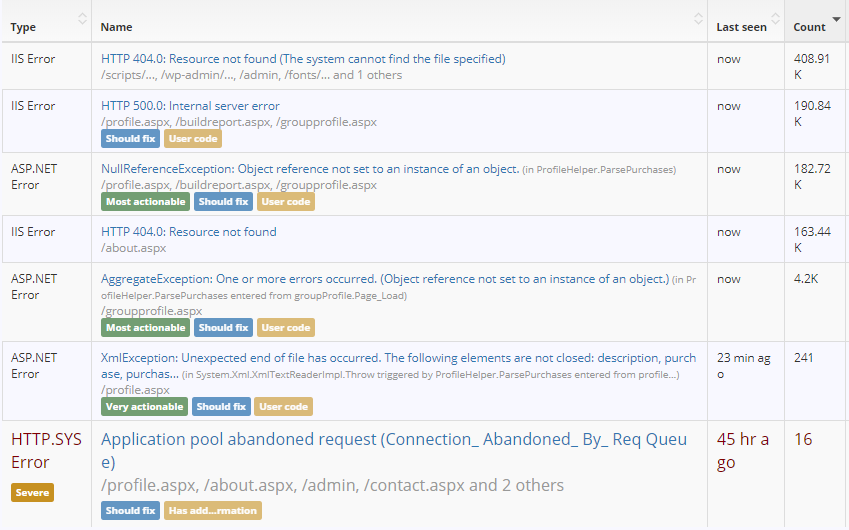
Break down all the errors by total impact to your website.
TIP: To make sure LeanSentry is seeing all your errors, follow these instructions to improve your error tracking.
For the complete details, see our Fix IIS, ASP.NET, and Http.sys errors guide for the details.
Tune the code causing the most slow requests
To fix the slow requests, you can use Hang diagnostics for moderate slowdowns, and the slow operation tracking for tracking smaller slowdowns across your website.
One way to begin is to go to the “Urls” tab of your website, and control-click the “Slow requests” column header to break down all the urls by the number of slow requests:
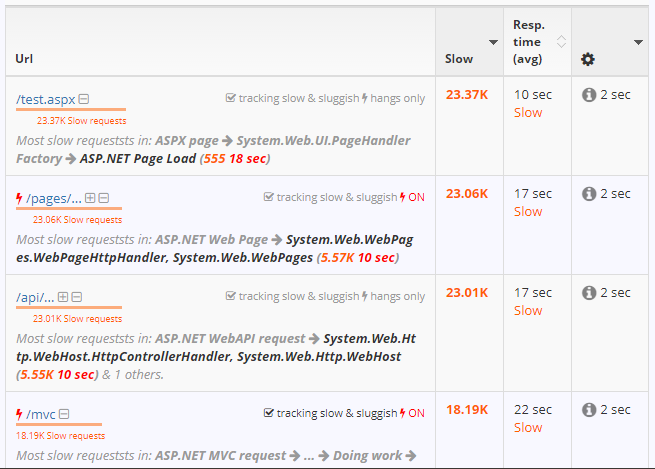
TIP: You’ll also want to make sure that LeanSentry is tracking the URLs in your website at the level that makes sense to you and your developers. For the details, see Customize URL tracking in LeanSentry to your application.
You can then select the URL and go to it’s “Slow operations” tab to view the causes of slow requests. Alternatively, you can go to the “Slow operations” tab for the entire website to view all slow operations:
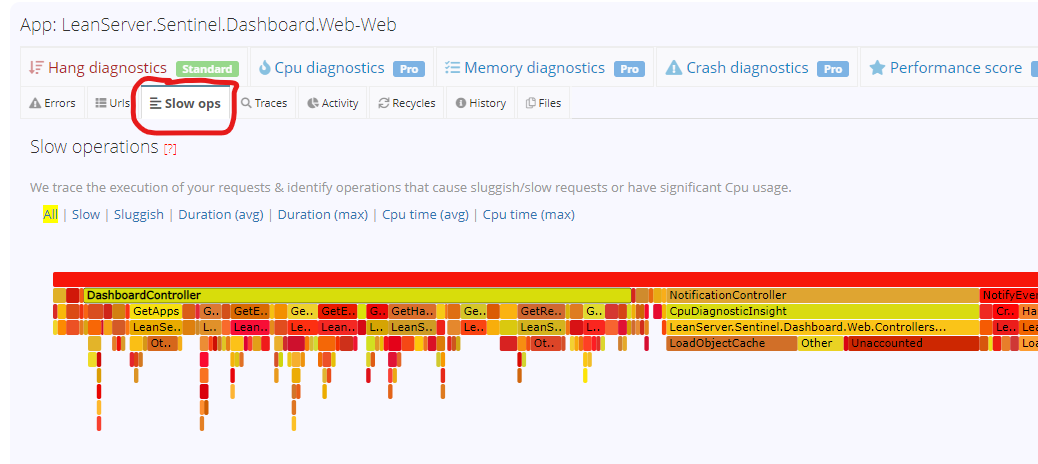
You can get-code level informations for the top slow operations, either over time as LeanSentry observes slow requests in during hang diagnostics, or by adding the ApplicationMonitoring.dll library to your application and/or adding trackers.
TIP: if you’d like to get both error details and slow request details added directly to your IIS logs, check out our Enhance IIS logging expert guide.
Optimize (Step 3)
If you are here, that means you stabilized all the major issues causing severe impact (Stabilize), and fixed errors/slow requests (Heal) to achieve a very high quality of service for your website.
At this point, you are free to take a well deserved rest. At least until LeanSentry alerts you of any new significant issues.
However, if you still have the strength (and time and interest), you can turn your attention to further opportunities to improve your website performance using the diagnostics collected by LeanSentry.
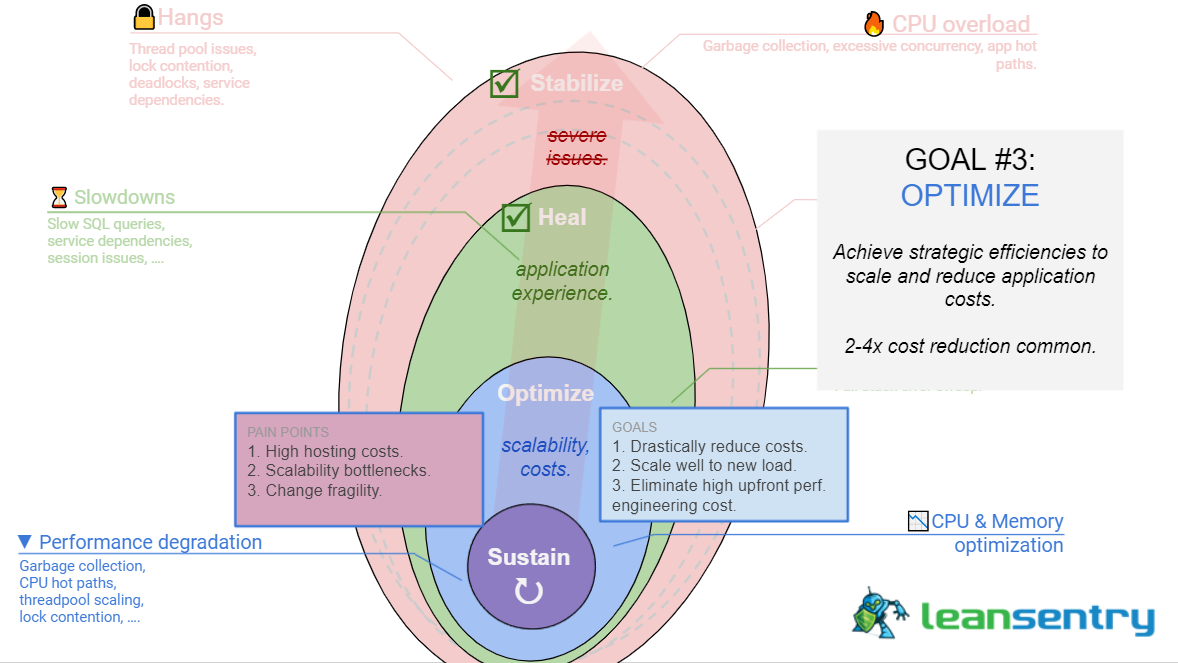
Pursuing these opportunities can unlock the following benefits for your application:
- Reduce operating costs (by lowering baseline/peak CPU usage to run with fewer VMs, and peak memory usage to reduce VM size)
- Reduce risk of future hangs/overloads under load.
- Improve scalability (ability to handle higher concurrent load)
- Improve average throughput and latency.
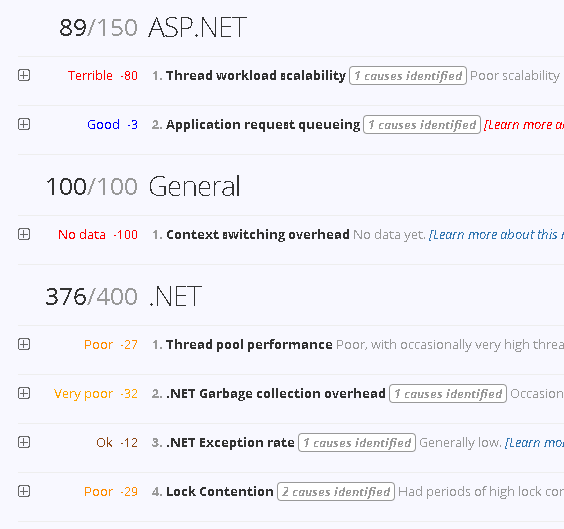
LeanSentry detecting opportunities to proactively improve your application performance.
During the Optimize phase, we can take advantage of the following diagnostics:
- CPU diagnostics to reduce baseline + peak CPU usage,
- Memory diagnostics to reduce peak memory usage,
- Recycle diagnostics to optimize recycling and warmup, and
- Performance score rules to improve application efficiency.
Tune CPU usage
We already covered using LeanSentry CPU diagnostics to address CPU overloads, which lead to 503 Queue Full outages, High CPU hangs, and performance degradation under load.
Now, we’ll revisit CPU diagnostics with a different goal: to proactively reduce the “normal” CPU usage of your applications. Doing this will allow larger applications to reduce the number of VMs needed to handle their workload, reducing their cloud costs. For smaller applications, the benefits will mostly come from being able to handle higher traffic with the same hardware, without experiencing performance degradation. And in most cases, these optimizations will result in lower avg. latencies.
Goal: Reduce your baseline CPU usage by 2x. Reduce your peak CPU usage by 2x.
How to do it:
- Back in the Cpu diagnostics tab of the website, you can choose to target your baseline CPU usage (the bulk of the histogram), or the occasional peak CPU usage (the long tail in the histogram), by selecting the range of usage in the histogram.
- Use the resultant reports to find opportunities to optimize the code contributing the most CPU usage.
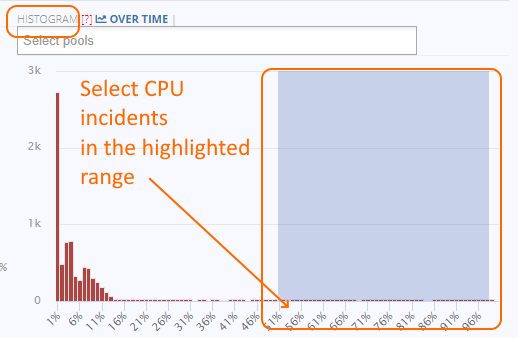
Review the Cpu diagnostic reports to identify opportunities for tuning the code contributing most of the CPU usage:
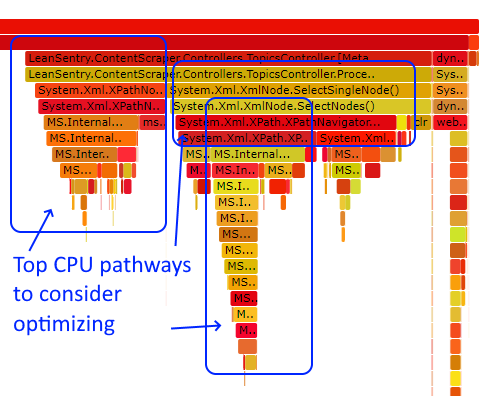
As before, see the Diagnose w3wp.exe high CPU usage guide for details on optimizing CPU usage in your applications.
Reduce memory usage
Memory usage is the primary driver of excessive cloud costs. This happens because most .NET applications experience memory leaks, and must be hosted in VMs that accommodate their “maximum” memory footprint in order to maintain adequate performance. Because memory size is static, and cannot usually be “scaled up” based on usage, memory leaks force you to upgrade to larger VM sizes.
In addition to this, inefficient memory allocation patterns can lead to high Garbage collection overhead, which can sap your processing power and increase the risk of hangs. To learn more about why this happens, see our Diagnose w3wp.exe memory usage guide.
For both of these reasons, optimizing your memory usage using LeanSentry Memory diagnostics is a worthwhile investment during the Optimize phase.

Goal: Reduce your peak Memory usage to your baseline. Reduce your baseline memory usage 2x.
How to do it:
- Head to the Memory diagnostics tab of the website, where again you can choose to target your baseline Memory usage (the bulk of the histogram), or the occasional peak Memory usage (the long tail in the histogram), by selecting the range of usage in the histogram.
- Collect a memory diagnostic report to understand where the memory usage comes from in each case.
- Compare the baseline memory analysis with the peak memory analysis, to understand where the “leak” comes from.
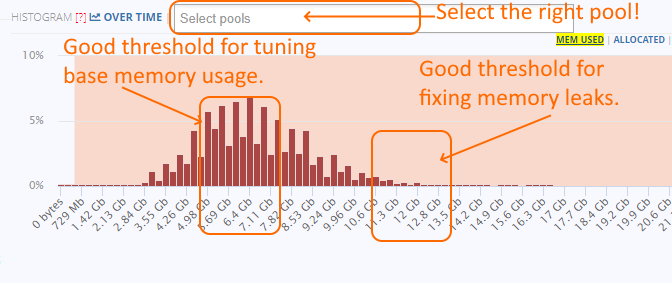
Because memory diagnostics are not enabled by default (unlike most other diagnostics LeanSentry that performs), you’ll need to decide whether to collect the memory diagnostic report on-demand or to enable LeanSentry to automatically diagnose memory usage when a certain memory threshold is reached.
Once you’ve collected the report, you can use it to determine which objects are causing your baseline or peak memory usage (for peak usage, it would help to compare a baseline report with a peak usage report). You can then drill into those objects to see where they are being referenced from, and find ways to “release” them from there.
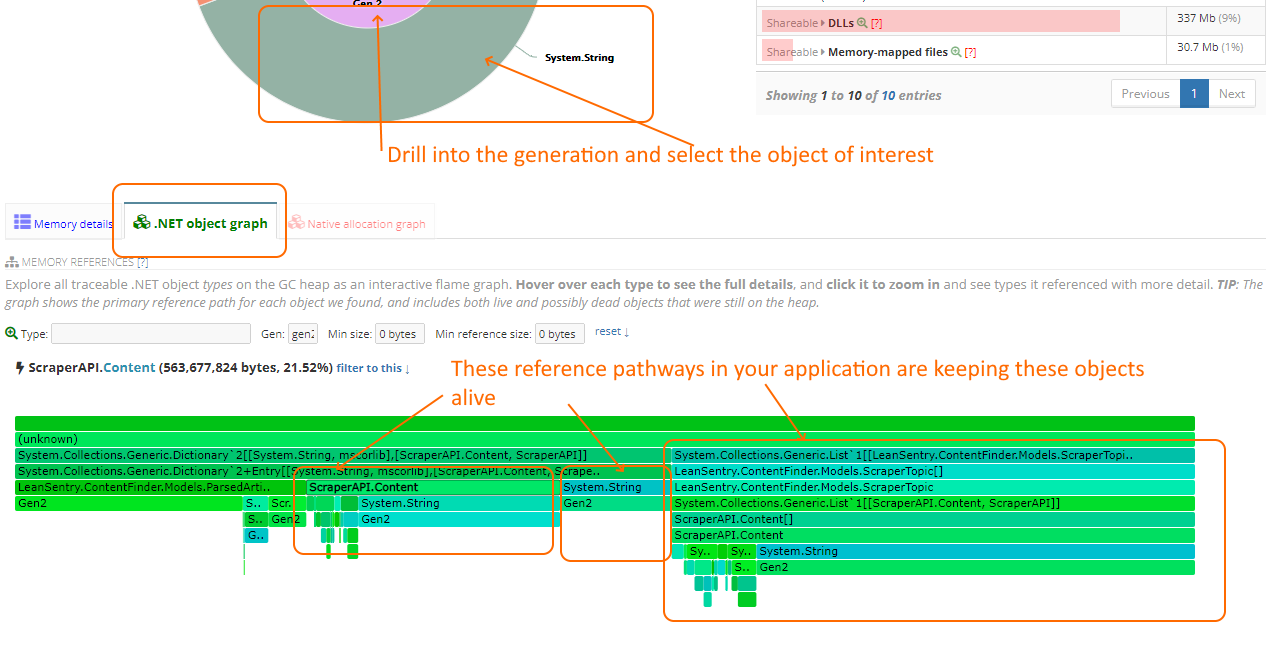
For the full walkthrough on using Memory diagnostics to optimize memory usage, see the Diagnose w3wp memory usage guide.
Optimizing recycling and warmup
For some applications, recycling can become a serious problem. This happens mostly if these conditions are true:
- The application must recycle very often, e.g. due to memory leaks or hangs. If so, fixing the hangs and memory leaks is always the right answer.
- The application has in-process session state or other state, and recycling causes the state to be lost. These applications should definitely migrate to out-of-process state to be resilient and enable better scaling.
- The application has a long warmup delay, so recycling during active service can cause an outage.
If this is the case, optimizing recycling can be of value to improve website health and performance. You can use LeanSentry recycle diagnostics to determine if your recycles cause long delays, or if there are more recycles than you’d like:
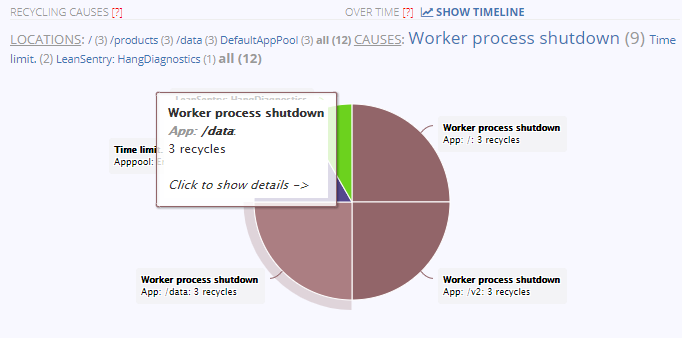
Goal: Make sure your application pool, and applications recycle as little as possible (ideally, less than once a day, with a scheduled recycle during offpeak times).
How to do it:
- Select your website and go to the “Recycle diagnostics” tab.
- If you have many recycles, go through their causes and address them.
- Switch from time limit recycling (default, 29 hours) to using a scheduled recycle during offpeak hours, if possible.
- Implement our recommended application warmup strategy to achieve always-warm, zero-downtime operation.
Proactive efficiency optimizations
Once you’ve optimized CPU usage, Memory usage, and excessive recycling, you can take further advantage of proactive performance opportunities detected by the LeanSentry Performance score rules.
These rules detect additional opportunities to improve performance and efficiency of your IIS, ASP.NET, and application layers. What’s more, these rules can automatically analyze your code to determine the specific application code that needs to be optimized.
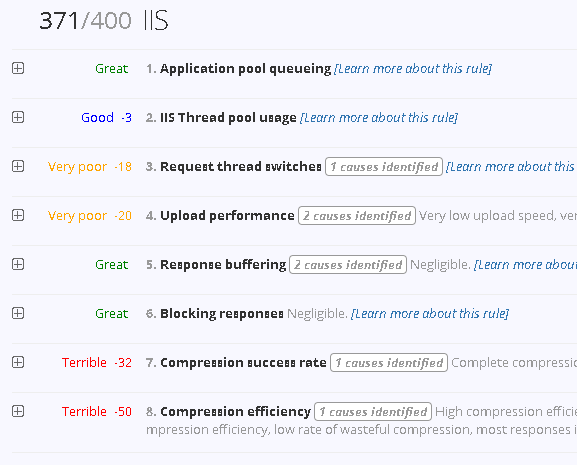
Goal: Address the rules with the worst performance scores to proactively improve application efficiency.
How to do it:
- Select your website and go to the “Performance score” tab.
- Find rules that have a poor score.
- Enable diagnostics for those rules, and use the data to make optimizations.
Each rule will tag your application with specific opportunities. If the rule has performed diagnostics, you’ll be able to see which code can be optimized:
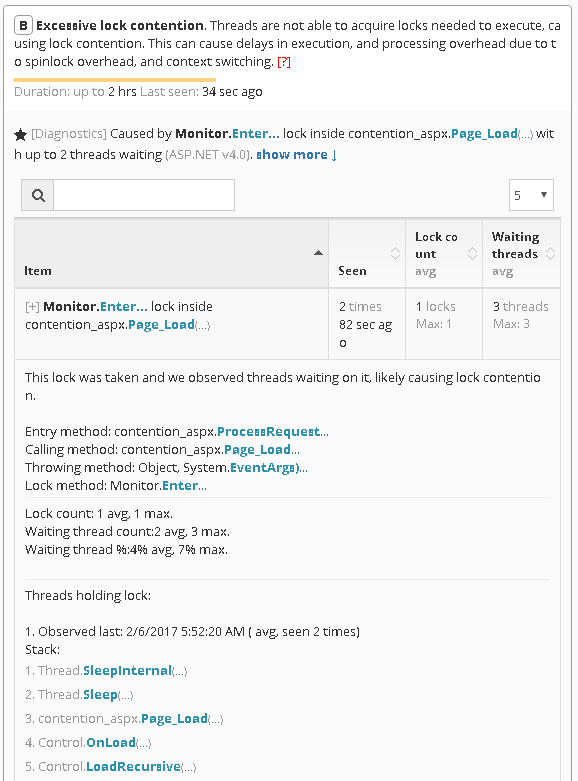
The Lock contention rule, detecting an opportunity to reduce lock contention in a specific part of the application.
HINT: Performance score rules provide an early detection warming for code bottlenecks that may not yet be affecting your site performance, but can turn into severe performance issues under higher load.
Sustain (step 4)
If you work through the model, even taking care of the low hanging fruit diagnosed by LeanSentry, you’ll end up with a clean performance slate.
Your website will be free of severe issues, provide an excellent quality of service to your users, and likely cost you 2-4x less to run.
(Not to mention the time, costs and frustrated saved by reducing the number of “reactive” incidents)
This is a state worth protecting.
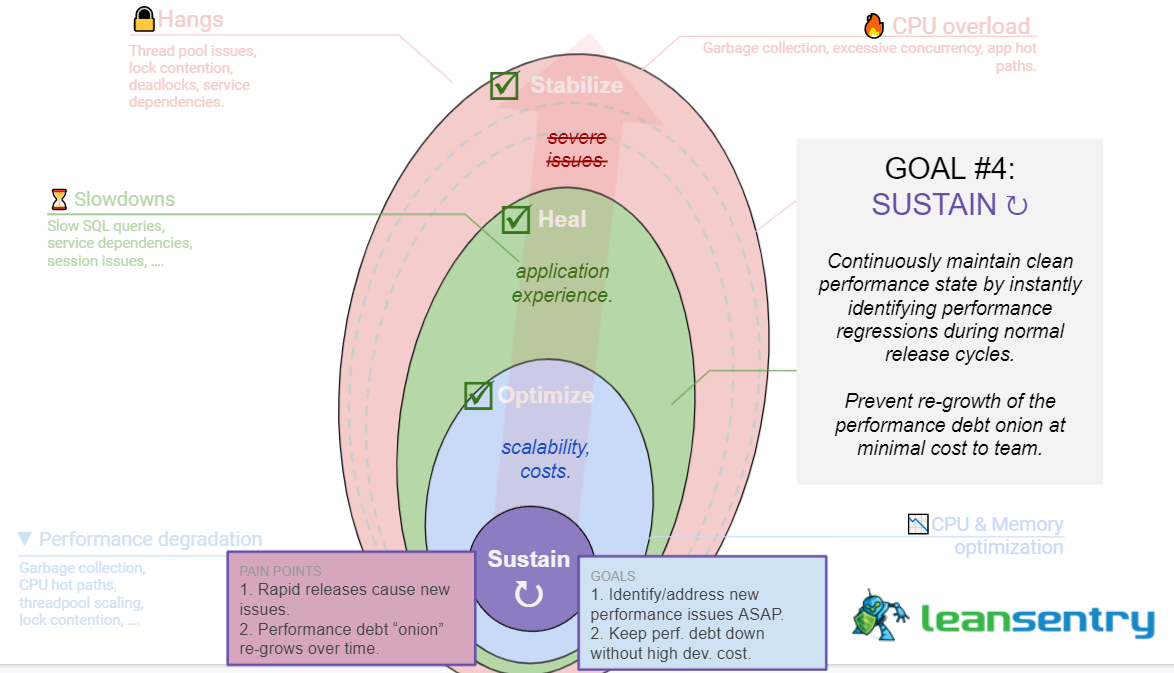
The good news is, that once your website is in the clean state, any new issues will become dreadfully obvious. LeanSentry will act as your insurance policy against these issues, diagnosing and alerting you about them whenever they arise.
(LeanSentry diagnostics automatically adjust to the actual performance of your application. Meaning that if your application has severe issues, we’ll only diagnose severe issues, but as your application improves, we’ll begin to occasionally diagnose some of the smaller issues as well.)
Because of the nature of performance problems, any hang, CPU or memory regression will be instantly visible on the backdrop of an otherwise clean, efficient application. This makes resolving future performance issues significantly easier than working with a “dirty” application.
Conclusion and checklist
The number one question LeanSentry customers ask is:
How do I best use the diagnostics provided by LeanSentry to proactively improve my website?
In this guide, we’ve provided the practical model we’ve used with hundreds of our Business tier customers to help them achieve (and keep) a clean performance state.
You can follow this model yourself to easily achieve the same results.

You can quickly follow the model using this checklist:
| Step | Goal/steps |
| 1: STABILIZE | Eliminate critical issues causing outages and severe performance impact. |
| 1.1 Fix hangs. | Use the Diagnose website hangs guide to fix all hangs over 10 blocked requests. |
| 1.2 Fix CPU overloads. | Use Diagnose w3wp.exe high CPU usage to tune code causing high CPU usage. |
| 1.3 Fix crashes. | Use Debug production crashes with LeanSentry to fix all crashes. |
| 1.4 (Optional) Fix severe memory leaks. | If your server encounters out of memory situations that you are not managing successfully with memory-based recycling, Diagnose w3wp memory usage. Otherwise, revisit memory optimization in the Optimize phase. |
| 1.5 (Optional) Fix severe recycling. | If your application pool or application recycle too often, or lose state/have long warmup times, optimize recycling and implement our best practice application pool warmup strategy. Otherwise, revisit recycling in the Optimize phase. |
| 1.6 (Optional) Fix severe errors. | If your application has severe errors, or has a very high error rate for the website and/or important URLs, fix those in this phase with Fix IIS, ASP.NET, and Http.sys errors. Otherwise, revisit errors in the Heal phase. |
| 2: HEAL | Improve quality of service, as measured by the satisfaction score. Target: 99%(A) or 99.9%(A+) for the entire website, and important URLs. |
| 2.1 Fix errors causing most failed requests. | Fix IIS, ASP.NET, and Http.sys errors. |
| 2.2 Optimize slow operations causing most slow requests. | Tune slow requests. |
| 3: OPTIMIZE | Reduce costs, improve resilience, increase efficiency and baseline performance. |
| 3.1 Tune CPU usage. | Tune baseline and peak CPU usage with Diagnose w3wp.exe high CPU usage to improve performance and reduce scaling costs. |
| 3.2 Reduce memory usage. | Diagnose w3wp memory usage to reduce baseline and peak memory usage, in order to avoid memory-based recycling and slash server costs. |
| 3.3 Reduce excessive recycling. | Avoid startup overhead and cold-start performance penalties by optimizing recycling and implementing the best practice application pool warmup strategy. |
| 3.4 Improve efficiency with proactive performance opportunities. | Use the Performance score diagnostics to seize performance improvement opportunities for your application. |
| 4: SUSTAIN | Maintain a clean performance state to preserve high quality of service, and keep support costs low. |
| 4.1 Respond to new issues to maintain the clean performance state. | Use LeanSentry alerts to fix new issues as they come up (it’s much cheaper in the clean state). |
That’s it! Armed with this prescriptive model, you can quickly turn LeanSentry diagnostics into actionable improvements for your website.
For detailed walkthroughs of how to use LeanSentry diagnostics to accomplish these tasks, be sure to check out our Getting started area and our in-depth IIS and ASP.NET guides.
If you need some additional assistance with interpreting diagnostics and identifying actionable improvements, be sure to take advantage of the expert support plans.
