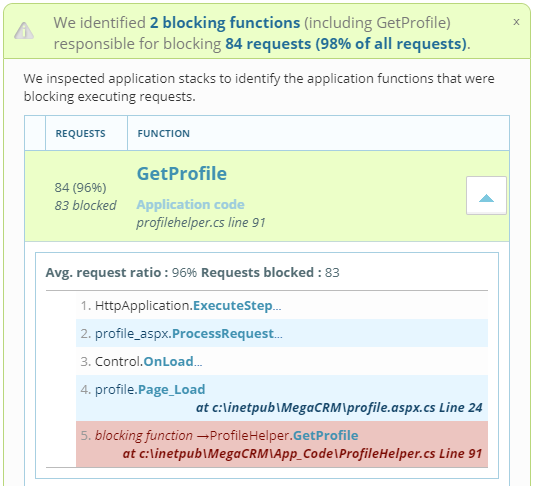
In this guide, I will show you how to troubleshoot an IIS or ASP.NET website hang in production, with the freely available Microsoft tools and techniques I've been using since the development of IIS 7.0.
Note: This is the original guide that inspired LeanSentry's own automatic hang diagnostics.
- Do you really have a hang?
- Diagnose the hang.
- Identify the code causing the hang.
- [LeaSentry only] Catch and diagnose hangs automatically.
All of a sudden, your website appears to have stopped working. Pages are taking forever to load. Your website is experiencing a hang!
Hangs are fairly common for production applications, and can be incredibly frustrating to troubleshoot. The main reason for this are:
- They may be happening only sometimes and can be hard to catch.
- They can be caused by complex and interrelated factors that can be difficult to isolate.
In this article, I'll show you how you can systematically isolate and diagnose most hangs in production. You'll need basic knowledge of Microsoft troubleshooting tools, and time.
STEP 1: Is it really a hang?
First, lets define what website hang really means.
An IIS website hangs whenever it appears to stop serving incoming requests, with requests either taking a very long time or timing out. It's generally caused by all available application threads becoming blocked, causing subsequent requests to get queued (or sometimes by the number of active requests exceeding configured concurrency limits).
Its important to differentiate the following kinds of hangs:
- Full hang. All requests to your application are very slow or time out. Symptoms include detectable request queueing, and sometimes 503 Service Unavailable errors when queue limits are reached.
NOTE: Most hangs do not involve high CPU, and are often called "low CPU hangs". Also, most of the time, high CPU does not itself cause a hang. In rare cases, you may also get a "high CPU hang", which we don't cover here.
-
Rolling hang. Most requests are slow, but eventually load. This usually occurs before a full hang develops, but may also represent a stable state for an application that is overloaded.
- Slow requests. Only specific URLs in your application are slow. This is not generally a true hang, but rather just a performance problem with a specific part of your application.
Here are 3 "reasonable" early detection signs:
-
"Http Service Request Queues\MaxQueueItemAge" performance counter increasing. This means IIS is falling behind in request processing, so all incoming requests are waiting at least this long to begin getting processed.
-
"Http Service Request Queues\ArrivalRate" counter exceeds the "W3WP_W3SVC\Requests / sec" counter for the application pool's worker process over a period of time. This basically implies that more requests are coming into the system than are being processed, and this always eventually results in queueing.
-
And the best way to detect a hang is: snapshotting currently executing requests. If the number of currently executing requests is growing, this can reliably tell you that requests are piling up ... which will always lead to higher latencies and request queueing.
Most importantly, this can also tell you which URLs are causing the hang, and which requests are queued.
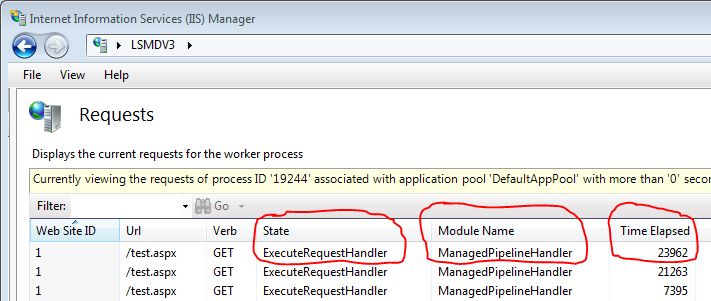
You can view all currently executing requests in InetMgr, by opening the server node, going to Worker Processes, and picking your application pool's worker process:
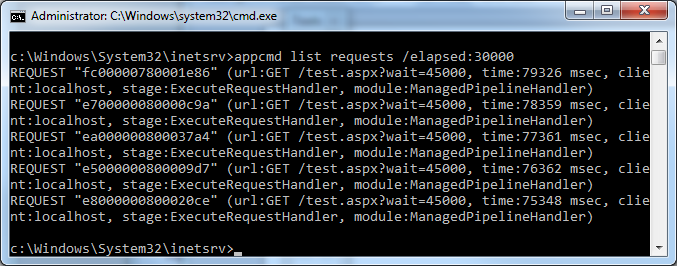
You can also automate this by using the AppCmd command line tool:
%windir%\system32\inetsrv\appcmd list requests /elapsed:10000
This will show you which requests are executing, optionally longer than the elapsed filter you specified. I recommend an elapsed filter of at least 5 seconds or longer.
![Hung requests shown by AppCmd List Requests command Hung requests shown by AppCmd List Requests command]()
If you see multiple requests that are taking a long time to execute AND you are seeing more and more requests begin to accumulate, you likely have a hang. If you DO NOT see requests accumulating, its likely that you have slow requests to some parts of your application, but you do not have a hang.
Detecting a hang reliably is suprisingly difficult. While you can almost always tell when you have a hang by requesting your website externally, detecting it internally can be surprisingly hard.
There are many possible places where a hang can happen, and many possible signs of hangs. Most of these signs are unreliable on their own (e.g. ASP .NET queueing counters), and the reliable ones (executing requests, thread snapshots) are prohibitively expensive to monitor all the time.
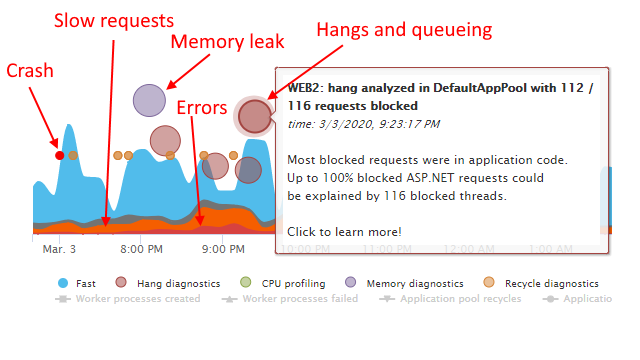
How LeanSentry detects hangs. With LeanSentry, we solved this problem by using progressive hang detection, which starts out with lightweight monitoring of more than a dozen different performance counters ... and then confirms a likely hang with executing request snapshots and the debugger.
Struggling with debugging hangs on your own? Learn more about resolving hangs quickly with LeanSentry's automatic hang diagnostics.
STEP 2: Diagnose the hang
Once you confirm the hang, the next step is to determine where its taking place.
It's not IIS (but check it anyway).
IIS hangs happen when all available IIS threads are blocked, causing IIS to stop dequeueing additional requests. This is rare these days, because IIS request threads almost never block. Instead, IIS hands off request processing to an ASP .NET, Classic ASP, or FastCGI application, freeing up its threads to dequeue more requests.
To quickly eliminate IIS as the source of the hang, check:
-
"Http Service Request Queues\CurrentQueueSize" counter. If its 0, IIS is having no problems dequeueing requests.
- "W3WP_W3SVC\Active Threads" counter. This will almost always be 0, or 1 because IIS threads almost never block. If its significantly higher, you likely have IIS thread blockage due to a custom module or because you explicitly configured ASP .NET to run on IIS threads. Consider increasing your MaxPoolThreads registry key.
Diagnose the hang.
Snapshot the currently executing requests to identify where blockage is taking place.
REQUEST "7000000780000548" (url:GET /test.aspx, time:30465 msec, client:localhost, stage:ExecuteRequestHandler, module:ManagedPipelineHandler)
REQUEST "f200000280000777" (url:GET /test.aspx, time:29071 msec, client:localhost, stage:ExecuteRequestHandler, module:ManagedPipelineHandler)
...
REQUEST "6f00000780000567" (url:GET /, time:1279 msec, client:localhost, stage:AuthenticateRequest, module:WindowsAuthentication)
REQUEST "7500020080000648" (url:GET /login, time:764 msec, client:localhost, stage:AuthenticateRequest, module:WindowsAuthentication)
You can use the resulting list of executing requests to learn A LOT about whats happening, including which URL is causing the blockage, and which requests are queued.
Expert tip #1: identifying requests causing the hang. You can identify which requests are the ones causing the hang because they will be at the front of the list, taking the longest time to execute. They will generally all be stuck in the same module and stage, and often the same URL.
If the hang is being caused by a specific ASP .NET controller or page, the module will say "IsapiModule" (Classic mode) or "ManagedPipelineHandler" (Integrated mode), and the stage will say "ExecuteRequestHandler". The URL should then point to the page/controller responsible.
Expert tip #2: Identifying queued requests. See the block of requests at the bottom of the list? These are the queued requests!
In Integrated mode, these will all have the module/stage corresponding to the first ASP .NET module in the pipeline. This will generally be "Windows Authentication" in "AuthenticateRequest" or sometimes "Session" in "AcquireRequestState".
STEP 3: What code is causing the hang? (for developers)
At this point, you've confirmed the hang, and determined where in your application its located (e.g. URL). The next and final step is for the developer to figure out what in the application code is causing the hang.
Are you that developer? Then, you know how hard it is to make this final leap, because most of the time hangs are very hard to reproduce in the test environment. Because of this, you'll likely need to analyze the hang in production while its still happening.
Here is how:
- Make sure you have Windows Debugging Tools installed on the server (takes longer), or get ProcDump (faster).
Expert tip #3: It always pays to have these tools available on each production server ahead of time. Taking the dump approach is usually faster and poses less impact to your production process, letting you analyze it offline. However, taking a dump could be a problem if your process memory is many Gbs in size.
- Identify the worker process for the application pool having the hang. The executing request list will show you the process id if you run it with the /xml switch.
- Attach the debugger to the process, OR, snapshot a dump using procdump and load it in a debugger later.
// attach debugger live (if you are fast)
ntsd -p [PID]
// or take a dump to attach later
procdump -ma -w [PID] c:\dump.dmp
ntsd -z c:\dump.dmp
- Snapshot the thread stacks, and exit. Make sure to detach before closing the debugger, to avoid killing the process!
.loadby sos clr
.loadby sos mscorwks
~*e!clrstack
.detach
qq
- The output will show you the code where each thread is currently executing. It will look like this:
OS Thread Id: 0x88b4 (7)
RetAddr          Call Site
000007fed5a43ec9 ASP.test_aspx.Page_Load(System.Object, System.EventArgs)
000007fee5a50562 System.Web.UI.Control.OnLoad(System.EventArgs)
000007fee5a4caec System.Web.UI.Control.LoadRecursive()
000007fee5a4beb0 System.Web.UI.Page.ProcessRequest()
000007ff001b0219 System.Web.UI.Page.ProcessRequest(System.Web.HttpContext)
000007fee5a53357 ASP.test_aspx.ProcessRequest(System.Web.HttpContext)
000007fee61fcc14 System.Web.Hosting.PipelineRuntime.ProcessRequestNotification(IntPtr, IntPtr, IntPtr, Int32)
- Wait 10-20 seconds, and do it again. If you are taking a dump, just take two dumps 10 seconds or so apart.
Alright. Once you have the two thread stack lists, your objective is to find thread ids that have the same stack in both snapshots. These stacks show the code that is blocking the threads, and thereby causing the hang.
NOTE: If you are only seeing a couple threads or no threads with the same stack, its likely because you either a) have a rolling hang where requests are taking a while but are still moving, or b) your application is asynchronous. If its async, debugging hangs is WAY harder because its nearly impossible to tell where requests are blocked without stacks. In this case, you need to implement custom application tracing across async boundaries to help you debug hangs. I will blog more about this in the near future.
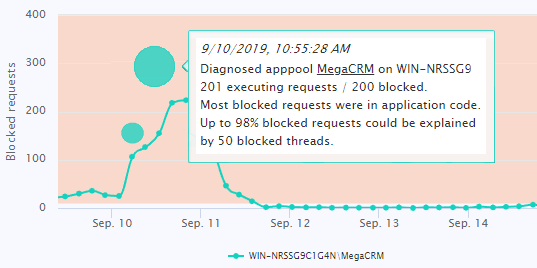
Determining root cause of hangs with LeanSentry. During the past 5 years, we've helped 1000s of customers fix hangs with LeanSentry. In doing so we learned that finding the offending code is only half the battle. The other half is understanding how and why the issue happens, and finding the correct AND cost-effective resolution to address it.
To assist with that, LeanSentry directly detects dozens of hang causes including thread pool exhaustion, deadlocks, slow functions and SQL queries, concurrency issues, CPU overload, and many more. We can then help the customer with the rest.
4. Detecting and fixing production hangs the right way
I can use the techniques above (automated with some internal tools) to diagnose most hangs. Thankfully, I don't have to do it anymore.
Why? Because its too hard to catch the hang in production, and be ready to debug it at just the right time. And on top of it, it just takes too much time and effort.
We built LeanSentry specifically to remove the need for this kind of troubleshooting. LeanSentry can automatically detect most hangs, and will instantly diagnose them for you. This eliminates the need to manually debug the hang, and performs much more precise analysis of the hang than is manually possible. I know I am biased, but I have to tell you that getting LeanSentry to catch/debug production hangs will be the best monitoring decision you've ever made.
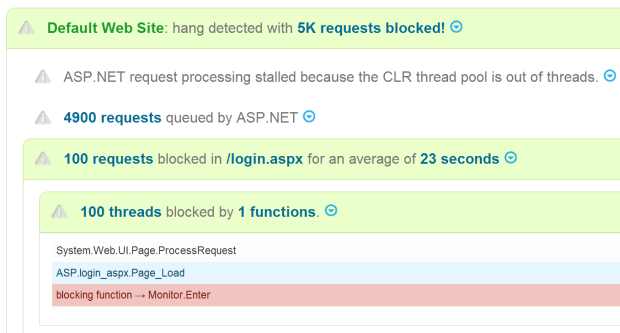
LeanSentry detects and instantly troubleshoots production hangs for you.
Wrap-up
I tried to keep this guide as short as possible given that hangs are a very complex topic. I glossed over a lot of details that you can find by signing up for the LeanSentry Production Troubleshooting course, or contacting me via my blog.
The bottom line is: hangs happen. When they happen, you need to move fast to diagnose them while they are happening. The techniques presented above will help you get it done, albeit with a bit of work.
P.S. If you are struggling with production hangs, CPU overloads, memory leaks and the like, deploy LeanSentry to diagnose and fix those issues the right way.
