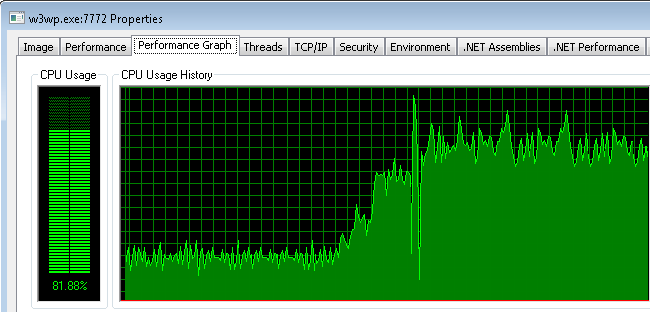
High CPU usage in the IIS worker process is the second most common performance complaint for production IIS websites.
In this guide, we are going to explore why this happens, and why W3WP high CPU usage can negatively impact and even take down IIS websites (due to hangs, thread pool exhaustion, queueing/503 queue full errors, and more).
We’ll also outline a more effective way to monitor IIS CPU usage, and detect when it causes a problem.
Finally, we’ll provide you with a practical approach to diagnosing the underlying causes of CPU usage in your application code, so that you can definitively resolve AND prevent CPU overloads in production.
But first, let’s take a look at why diagnosing high CPU incidents in production tends to be so hard...
The reason why your IIS worker process has high CPU usage
After using LeanSentry to help diagnose and resolve performance issues in 30K+ IIS websites over the last decade, we’ve discovered one simple but valuable fact:
The actual cause of high CPU usage in production is almost always NOT what you think it is!
It’s usually not because of high traffic, denial of service attacks, or “just because our application has to do a lot of work”. It’s also not because of IIS being misconfigured (a favorite goto for application developers unable to reproduce the CPU usage in their local dev environments).
Instead, the top causes of w3wp exe high CPU usage tend to be application code aspects that you would normally never think about or see during testing, but nonetheless happen when the application experiences peak traffic or an unexpected workload. Things like:
- Logging library logging a large number of database errors to disk.
- Monitor lock contention on an application lock.
- MVC action parameter binding, or serializing large JSON responses.
- Query compilation of a particularly complex LINQ query expression.
(sound familiar?)
This partially explains why code reviews, and even proactive testing/tuning in a test environment, often fails to find the true cause of production CPU overloads. Without knowing exactly what code is causing the high w3wp CPU in production at the EXACT TIME of the overload, you are probably optimizing the wrong code!
It turns out that this is actually good news!
First, because the cause of high CPU usage in the application is often of “secondary” nature to the application’s functionality, it can be easily modified or removed without affecting the application’s functionality. For example, the logging can be modified not to log a specific event, or lock contention can be removed by implementing a low lock pattern.
Second, it means that extensive rewrites or performance testing of application code is not typically required. This can save a lot of development time.
Instead, all we need to do is determine the application code causing the high CPU usage in the IIS worker process, at the exact time when it causes a hang or website performance degradation in production.
If we can do this, we can minimally optimize the right code and prevent this from happening in the future.
Proactive performance testing: the tale of two camps
In my experience, teams often fall into one of two camps when it comes to CPU optimization:
We ignore the application’s CPU usage until it becomes a problem. These teams assume that the CPU utilization “is what it is”, in other words it’s the computational cost of hosting the website’s workload. As a result, these applications tend to run hot, and often experience CPU overloads which can cause downtime and poor performance.
The knee jerk reaction is to throw more hardware at the problem, which then also ensures that the hosting costs/cloud costs for running your application are 2-5x higher than they really need to be. At the same time, the application likely still experiences high CPU usage and overloads during peak traffic.
We proactively test and tune the application code before deployment! These teams spend a lot of time in their release cycle running tests and optimizing the code. Yet, the return on investment for these activities can be spotty, because they take a lot of developer effort … and the application can still experience CPU overloads in production! This happens because it’s nearly impossible to properly simulate a real production workload in a test environment … which means that they are likely to optimize the wrong code. Additionally, scheduling optimization time for the dev teams is often an expensive exercise and does not usually keep up with the pace of application changes.
Both camps experience more CPU overloads than desired, and end up spending more time and resources dealing with high CPU usage.
Instead, what we found works best is a “lean” opportunistic approach: capture the CPU peaks in production and optimize them aggressively. This leaks to minimum development work upfront, delivers the right fixes for the actual bottlenecks exposed by production workloads, and ensures that over time the application becomes faster, more efficient, and achieves lower hosting costs.
Monitoring IIS worker process CPU usage
To properly detect instances of CPU overload, we have to look a bit further than the CPU usage of the server or the IIS worker process.
This is because, in an ideal world, your application’s CPU usage is “elastic”. Meaning, the w3wp.exe consumes more CPU as it handles a higher workload, and is able to use up the entire processor bandwidth of the server without experiencing significant performance degradation. This is the case for many simpler CPU intensive software workloads like rendering, compression, and even some very simple web workloads e.g. serving static files out of the cache.
Unfortunately, most modern web applications are not elastic enough when it comes to CPU usage. Instead of “stretching” when the CPU usage increases, the application chokes instead. Instead of experiencing a slight slowdown, your website might begin to throw 503 Queue Full errors, experience very slow response times, or hang.
Worse yet, these issues may begin to crop well before your server is at 100% CPU usage.
High worker process CPU usage often causes severe performance degradation because of the complex interplay between the async/parallel nature of modern web application code, thread pool starvation and exhaustion, and garbage collection. We explain these regressive mechanisms in detail below.
Before we do that, let’s dig into how to properly monitor IIS CPU usage and detect CPU overloads.
Detecting CPU overloads
Your IIS monitoring strategy for CPU overloads needs to include monitoring IIS website performance together with CPU usage. The CPU overload exists when the CPU usage of the worker process or server is high, AND performance is degraded.
To perform accurate CPU overload detection, LeanSentry CPU Diagnostics use a large number of IIS and process metrics, including a number of threading and request processing performance counters.
If you are monitoring this manually or using a basic (non-diagnostic) APM tool that simply watches performance counters, you can boil this monitoring down to three main components:
Monitoring slow requests caused by high CPU
Is a high percentage of your requests completing slower than desired?
An older way to measure this would be to look at response times for completing requests, e.g. using average latency or 99% percentile response time. This approach has many issues, including being easily skewed by outliers (e.g. a handful of very slow requests due to external database delays) or hiding significant issues by diluting the metric with many very fast requests (e.g. thousands of very static file requests).
At LeanSentry, we use a metric called Satisfaction score (similar to Apdex) which counts up the number of slow requests in your IIS logs as a percentage of your overall traffic. We allow you to specify custom response time thresholds for the website and for specific urls, so the “slow request” determination is meaningful for different parts of your application.

(If you are not using LeanSentry, you can compute your own satisfaction score monitoring using our IIS log analysis guide.)
If the IIS worker process is experiencing high CPU that’s affecting your website performance, the percentage of slow requests will rapidly increase.
If your workload is elastic wrt. CPU usage, you may see a very small change in slow requests, even if all your requests are slightly slower. In this case, congratulations, you are making great use of your server processing bandwidth!
Monitoring application queueing and 503 Queue Full errors
Server CPU overload will often cause application pools to experience queueing. Application pool queueing happens when the IIS worker process is unable to dequeue the incoming requests fast enough, usually because:
- The server CPU is completely overloaded.
- There are not enough threads in the IIS thread pool to dequeue incoming requests.
- Your website has a VERY HIGH throughput (RPS).
When this happens, the requests queue up in the application pool queue.
If you have LeanSentry error monitoring, it will automatically detect queueing and analyze IIS thread pool problems causing queueing, including determining the application code causing the CPU overload (and thereby causing queueing). If you don’t have LeanSentry, we’ll review options for doing the CPU code analysis yourself below.
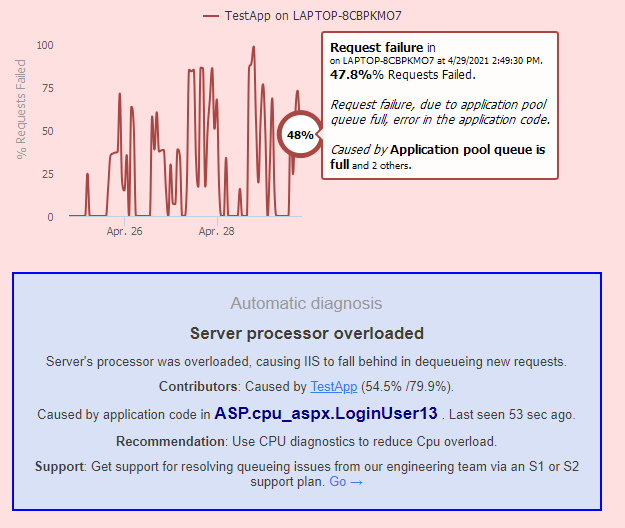
A simple way to monitor IIS application pool queueing is by watching these two metrics:
| Metric | Data source |
| Application pool queue length
The number of requests waiting for the IIS worker process to dequeue them. |
Performance counters:
HTTP Service Request Queues\CurrentQueueSize You should monitor these separately for each application pool. |
| 503 Queue Full errors
Requests rejected by HTTP.SYS with the 503 Queue Full error code, due to the application pool queue being full. |
The HTTPERR error logs, located in:
c:\windows\system32\logfiles\HTTPERR If you have 503 Queue Full errors, you’ll see entries like: 2021-09-08 23:01:06 ::1%0 61091 ::1%0 8990 HTTP/1.1 GET /test.aspx - - 503 4 QueueFull TestApp TCP 2021-09-08 23:01:06 ::1%0 61092 ::1%0 8990 HTTP/1.1 GET /test.aspx - - 503 4 QueueFull TestApp TCP 2021-09-08 23:01:06 ::1%0 61093 ::1%0 8990 HTTP/1.1 GET /test.aspx - - 503 4 QueueFull TestApp TCP … You can also monitor the HTTP Service Request Queues\RejectedRequests performance counter, but we prefer the HTTPERR log because the rejected requests counter can represent many different types of application pool failures outside of QueueFull. |
If the CPU overload is severe enough, or is combining with IIS thread pool issues, you’ll see the application pool queue growing, and eventually causing 503 Queue Full errors when the queue size exceeds the configured application pool queue limit (1000 by default).
Normally, if your server is coping well with the workload, you should have zero 503 errors, and ideally an empty application pool queue (or a queue with more than 100 requests queued).
Monitoring IIS hangs
Secondly, we want to watch for signs of high CPU hangs, which are usually caused by deadlocks or severe performance degradation due to thread pool starvation.
If you have LeanSentry, it will automatically detect these types of hangs and determine the issue causing performance degradation, down to the offending application code:
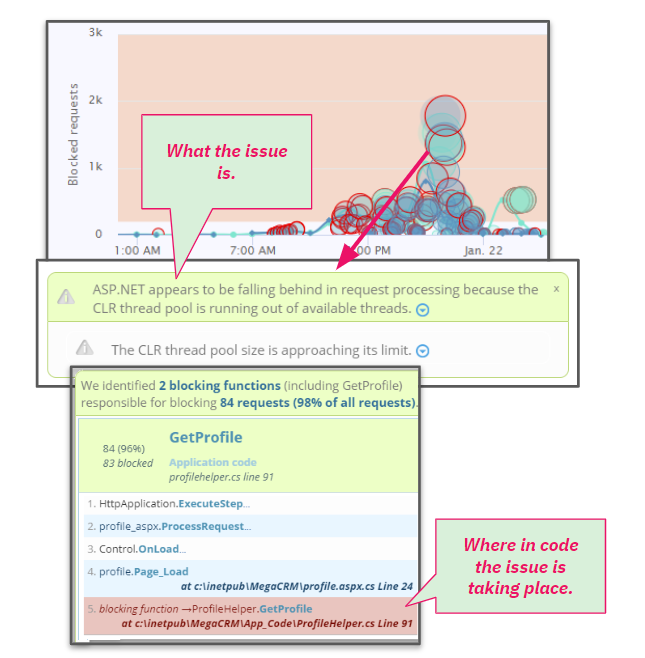
If you don’t have LeanSentry, you can perform your own simple hang monitoring by watching two things:
- The number of active requests to your website.
- The currently executing requests that appear “blocked”.
If your worker process has high CPU usage and is experiencing a high CPU hang, it will always show a large increase in active requests (because the requests are getting “stuck” and not completing).
This metric is better to monitor than RPS, because RPS is strongly affected by the rate of incoming requests to your website and can vary widely whether or not a hang exists. A hang cannot exist on a production website without a large number of “active requests”.
Additionally, a hang will show requests “stuck” for a long time (we use 10 sec by default), as opposed to a large number of “new” requests. If you have a large number of relatively new requests and high CPU, again, congratulations, your website is stretching to its workload and does not have a hang.
| Metric | Data source |
| Active Requests
The number of requests being processed inside the IIS worker process. |
Performance counters:
W3SVC_W3WP\Active Requests This number is reported per IIS worker process, for example W3SVC_W3WP(15740_DefaultAppPool)\Active Requests. Because of this, you may need to link these counters to the associated application pools and aggregate them if you have multiple worker processes per pool (web gardens). |
| Blocked requests
The requests being executed in the IIS worker process, with information on how long they’ve been processing and where in the request processing pipeline they are currently “stuck”. |
Appcmd command:
appcmd list requests /elapsed:10000 This command lists all requests that have been executing in the worker process for more than 10 seconds. While it’s normal to have requests take a bit longer to finish under CPU load, a hang will show requests being “stuck” for a much longer time than usual. |
If you do have a hang, you’ll see a number of requests “stuck” or queued up, most likely in the “ExecuteRequestHandler” application handler stage:
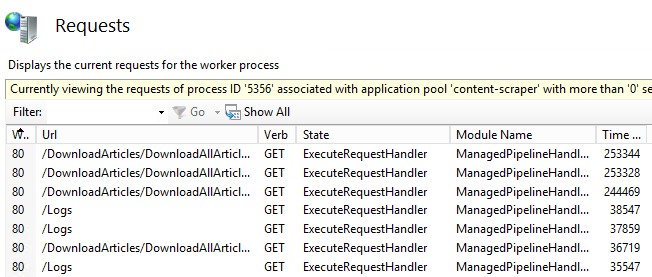
If your server CPU is overloaded, but your workload is elastic, you are likely to observe many active requests with a relatively short time elapsed. This is reasonable, since everything is taking longer to execute.
However, if you are seeing a lot of requests with elapsed times of 10 seconds or higher, you have an inelastic workload and likely have a high CPU hang. We’ll dig into why this happens and how to resolve high CPU hangs below.
Monitoring CPU usage of the IIS worker process
To detect high CPU usage in the IIS worker process, you can simply monitor the following:
- The CPU usage of w3wp.exe, using the performance counter Process\% Processor Time.
- The CPU usage of the server itself, using the Processor\% Processor Time(_Total) performance counter.
- The processor queue length, using the System\Processor Queue Length performance counter.
In combination with the slow request, queue/503, and hang monitoring above, this can help us figure out what kind of issues we may have.
Bringing it all together
Using the metrics above, this IIS performance monitoring strategy can both detect and classify instances of CPU overload to help shape your response:
- If the IIS worker process has high CPU usage and is experiencing performance degradation, but the server is NOT completely overloaded (Server processor time <=95%, and Processor queue length <= 10), your application is inelastic wrt. CPU usage. You can then optimize the code to make it more elastic by removing the bottlenecks triggered by the high CPU usage*.
- If the IIS worker process has high CPU usage, and the server is completely overloaded (>= 95% and/or processor queue length 10+), optimize the application code to reduce CPU impact on the server.
- If w3wp.exe high CPU usage is not present, but the server has high CPU usage or a high queue, the server is experiencing a CPU overload. In that case, we need to identify the process that has the most CPU usage OR has the most active threads, and remove it/reduce workload/optimize its code to alleviate the overload on the server.
* You can also optimize the code to reduce CPU usage, but this is likely not enough because additional workload increases can trigger the hang conditions again. Removing the hang conditions works better because it then allows your application to gracefully “stretch” to higher workloads and higher CPU utilization without failing.
Before we dig into HOW to determine the code causing high CPU usage in the worker process, let’s dig into the reasons why high CPU usage can cause severe performance degradation for typical IIS websites.
(If you’d like to skip straight to diagnosing the code causing high CPU usage, go here)
The effects of high CPU usage on IIS worker process performance
I like to think of the IIS and ASP.NET stack (web server and the web application framework) as a top-of-the-line pipeline. It’s large, smooth, and has been tested to deliver a sustained flow of tens of thousands of gallons of water per second.
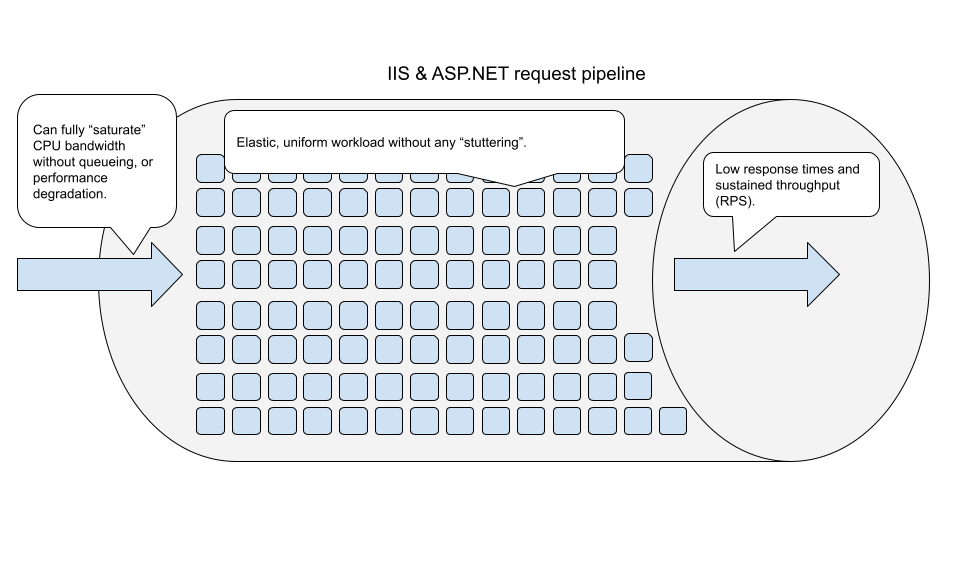
Theoretically, it should be possible to continuously push as much water through this pipeline as possible (100% CPU usage), with sustained performance.
Unfortunately, most applications have a workflow that’s not water. Instead, it’s more like a sludge of rocks, sticks, and other random objects that got stuck in a landslide. When the flow is small (e.g. during testing, or during off peak hours), the sludge easily slides down the pipeline without much trouble.
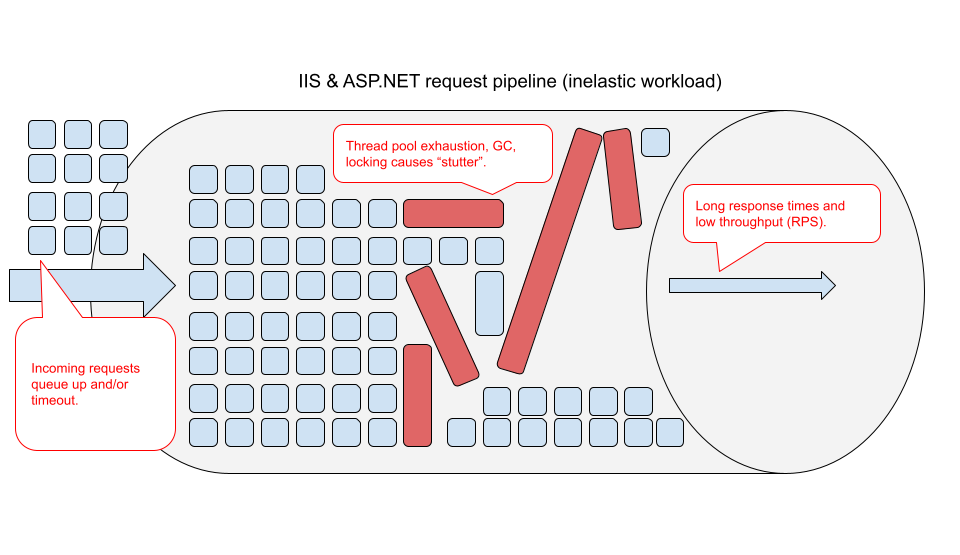
However, when the flow increases, the sludge begins to clog the pipeline, as variously sized pieces begin to get stuck on themselves. These blockages slow the flow through the pipeline. At some points, the workflow can get completely clogged, bringing the flow to a halt. Maintenance has to clear the blockage to “reset” the pipeline and hope for the best.
(Check out our Resetting IIS guide for practical guidance on how to best handle recycling and restarts in production).
In this reality, you may not be able to use more than 50-80% of the pipeline’s bandwidth (server CPU usage) before it begins to experience problems. And, if you temporarily get to a higher usage level, you risk clogging the pipeline completely (a high CPU hang).
I hope that this metaphor does not cause too much offense. I don’t mean to imply that your application code is dirty or bad, just that most real world application workloads do not “fit nearly” and frictionlessly in the high speed pipeline that is your web application framework. And when the flow is high, including when your CPU usage is high, many applications experience a serious risk of performance degradation, thread pool exhaustion, hangs and deadlocks.
Here are some of the common reasons why this happens:
CPU overload causes thread pool exhaustion
ASP.NET requests are processed by CLR thread pool threads. This is also true for Classic ASP scripts (they use the Classic ASP thread pool), PHP scripts (use the PHP thread pool inside the PHP-CGI.exe worker process), but we’ll focus on ASP.NET here.
When the CPU usage on the server exceeds 81%, the thread pool stops creating new threads, even if the number of threads is well below the configured maximum limit. When combined with blocking operations, even if they are short lived, this can rapidly cause the thread pool to run out of threads. As a result, new requests being pumped into the worker process will queue up waiting for CLR threads.
This is a very common cause of ASP.NET hangs as is, but under high CPU usage, the risk of hangs increases dramatically. You can read more about hangs on our hangs guide.
If you have LeanSentry, it will detect this case and identify the specific code that’s causing thread blockage under CPU pressure:
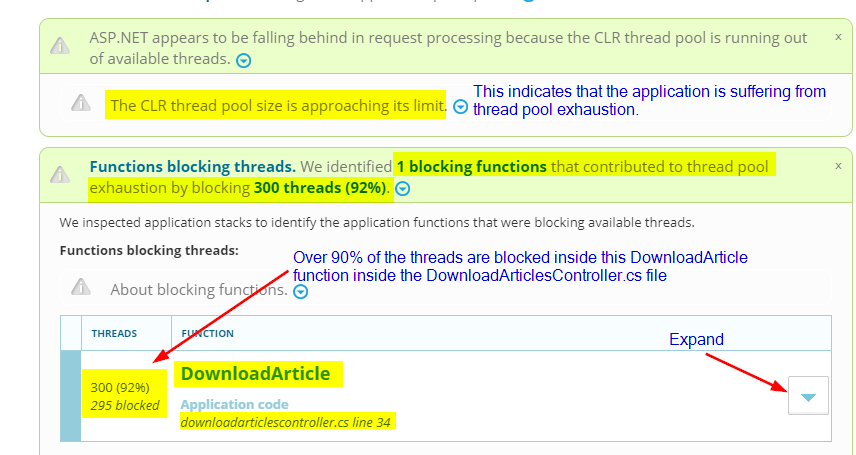
To fix this, you must reduce blockage in the relevant code by using caching, or invoking the blocking operation asynchronously if possible. Even that, however, can have problems as we’ll see next.
CPU overload causes task starvation
Most modern ASP.NET applications heavily rely on asynchronous tasks, and some use parallel tasks to take better advantage of multi-core processing power (the latter usually turns out to be a BAD idea in already highly concurrent web applications). Async is normally great for reducing thread pressure in the system, and scaling to high workload concurrency without hitting thread pool exhaustion.
However, this advantage can become a problem under high CPU usage.
This happens because when asynchronous operations complete, they often require a CLR thread pool worker thread to “resume” request processing. This works great if there are threads in the thread pool. If CPU usage causes thread pool exhaustion, the async tasks will begin to compete for threads with incoming requests.

Under high CPU usage, this competition can create an effective deadlock, where existing requests are unable to complete because the available threads are being occupied by new requests coming into the system. This can be particularly bad because async applications usually get by with very few threads, so when the high CPU usage hits, the system may be unable to scale the thread pool to the completion demands of the async workload.
This situation can cause a complete deadlock when combined with locking, as we’ve seen with many unexpected async hangs due to locking inside Redis connection multiplexing, ASP.NET legacy synchronization contexts, and so forth.
You can read more about this problem over at this great thread pool starvation post from Criteo Labs.
IIS thread pool starvation
This problem takes place in the IIS thread pool, a different thread pool from the CLR thread pool that we’ve been talking about. Under high CPU usage, your IIS worker process can experience IIS thread pool starvation, which will then cause requests to queue up in the application pool queue.
This application pool queueing introduces a further processing delay to ALL incoming requests, and eventually causes a site outage as all requests begin to get rejected with 503 Queue Full errors.
That said, in a way, this a good thing, because if your IIS worker process has high CPU usage already you don’t want IIS to pump more requests into it (making the overload worse). The only viable solution here is to reduce the CPU overload by optimizing the application code. Then, the server will be able to dequeue more requests AND process more of them.
If you have LeanSentry, it will automatically diagnose 503 Queue Full incidents as I mentioned earlier, but also proactively look at your IIS thread usage and identify potential blockages that can lead to queue full issues earlier than normal:
 LeanSentry diagnosing IIS thread pool blockage issues that can lead to 503 Queue Full incidents.
You can learn all about IIS threading issues in our IIS thread pool guide.
Timeouts
When w3wp has high CPU usage, and you are experiencing thread delays due to thread pool starvation, task starvation, and just generally slower code execution, you are much more likely to experience timeouts in the application code.
In the worst case, this can lead to a situation where most of your workload is failing with timeouts. In this case, you are still paying the price for processing the requests that fail with errors, without receiving any benefit.
This brings me to the last point: wasted processing.
Wasted processing
This is perhaps the most insidious problem that happens under CPU overload, is that your application may be spending most of its time processing requests that are doomed to fail anyway.
When the server CPU is overloaded, and requests are taking longer than 5-10 seconds due to a combination of queueing, thread pool starvation, and task completion delays, the users making those requests are likely to either refresh the page or move on to other websites.
As a result, your website is now both handling more requests than needed (due to retries) AND the results of many of those are not being seen because they took too long.
This can further perpetuate the CPU overload state, while making your website effectively down for your users.
In addition to this, under heavy CPU usage, your server is likely paying additional overhead on top of your application workload. This includes:
Context switching
With many active threads in the system, the processor may be spending quite a bit of time switching between threads as opposed to doing useful work.
If you have LeanSentry, you can detect this issue using our Context switching diagnostic:
 LeanSentry detecting excessive context switching, and determining the application code causing it.
If you don’t have LeanSentry, you can generally monitor Context switching using the “System\Context Switches/sec” performance counter, although we also monitor the counts of runnable threads in the system which requires a more complex algorithm.
(LeanSentry diagnoses context switching by monitoring the number of “runnable threads” in the system, and when the context switching is high and the runnable thread count is high, it determines the process with the high number of runnable threads and performs a debugger-based thread analysis.)
Elevated garbage collection overhead
Your CPU overload may be exacerbated by garbage collection, which in some cases can take anywhere from 20-100% of the total CPU time! When the CPU is overloaded, the garbage collector may be taking a while to complete it’s scans, which may also be pausing your application in addition to the CPU execution delays.
If you have LeanSentry, you can perform Memory diagnostics to analyze the .NET memory allocation patterns that may be causing elevated GC overhead:
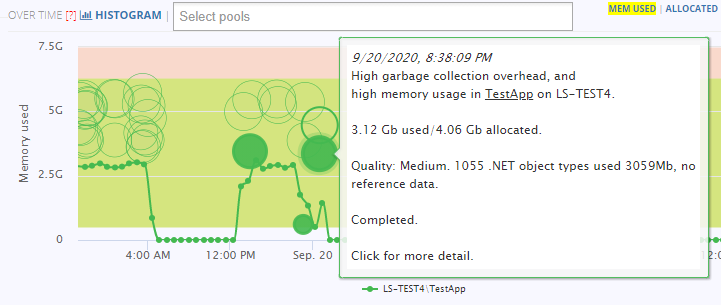
You can then use the memory diagnostic report to identify which application objects are contributing to excessive garbage collection, which almost always boils down to:
- Very large Gen2, also known as “midlife crisis” (when a lot of objects end up moving to the “long lived” generation 2 just to be cleaned up later).
- Large/fragmented LOH (Large Object Heap) storing big byte arrays, strings, or large arrays backing data tables.
You can then zoom into these specific heaps (e.g. Gen2 or LOH) to find which objects are contributing, and then zoom into their reference pathways in the code to figure out how to stop allocating them or release those objects early to reduce garbage collection overhead.
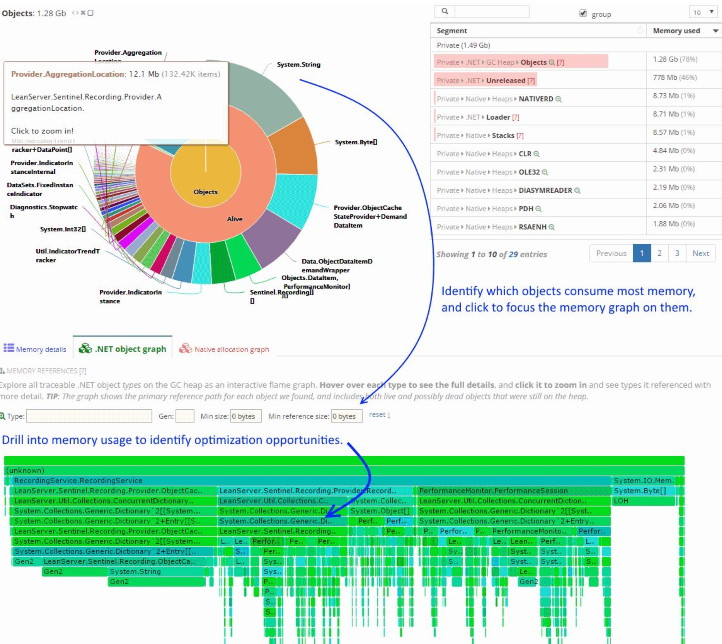
If you don’t have LeanSentry, you can monitor the “.NET CLR Memory(*)\% Time in GC” performance counter for individual IIS worker processes AND the IIS worker process CPU usage, to determine when the w3wp has a CPU overload due to elevated Garbage collection activity.
Getting to the bottom of the WHY the garbage collection is elevated requires a deeper analysis which is usually very difficult to do in production without the prohibitive impact of memory profiling tools, so consider the LeanSentry memory diagnostics which can perform that analysis at the right time and usually only last 10-60 seconds.
Lock contention
Your application threads may be spinning the CPU waiting on locks taken by a single thread that’s taking a while to complete. We see many such CPU overloads, where the IIS worker process is at 100% CPU while basically doing almost NO useful work.
In this pattern, you have 1 thread that has entered a lock using the lock keyword or Monitor.Enter.
Then, you’ll have many threads that are attempting to enter the lock, which initially triggers a spin wait, which is basically a short CPU loop that tries to get the lock before putting the thread in a Wait state. When you have tens or hundreds of threads spin waiting, this easily triggers a CPU overload.
This is a VERY common contributor to (and even primary cause of) CPU overheads that we see in .NET web applications. Luckily, the fix can usually be simple, once the specific code contending on the lock is identified.
You can once again use the LeanSentry Hang diagnostics to identify this code if it causes a hang, or proactively detect instances of lock contention that may be sapping your CPU cycles:
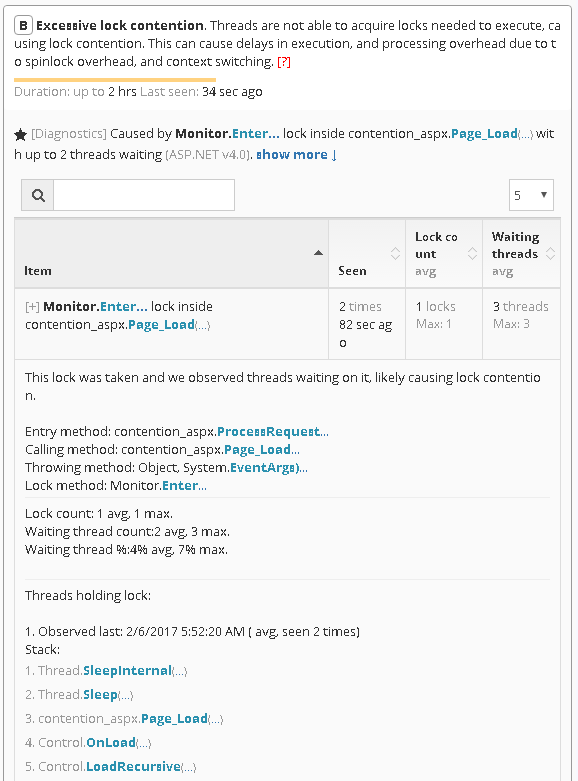 LeanSentry detecting elevated lock contention, and diagnosing the code causing it.
Fix high CPU usage in the IIS worker process
To fix the high CPU usage, you will need to do two things:
- Eliminate the blockages causing poor performance under high CPU usage (making your workload more elastic).
- Reduce CPU usage of the application code, to avoid CPU overloads and be able to handle more traffic.
We covered the main reasons why high CPU usage can cause poor website performance, even when the server processor is not completely overloaded. In my opinion, fixing these is MUCH more valuable than tuning the application code to have lower CPU usage, because it makes your application more resilient and scalable at higher load.
It also paves the way for proactive CPU optimization that will enable you to increase performance and handle more load with fewer resources, lowering your cloud or hosting costs.
Next, let’s look at how to optimize your application’s CPU usage in production.
Determine the code causing high CPU usage in the IIS worker process
To reduce your server CPU usage, in order to avoid CPU overloads and/or to proactively improve performance and handle more load, you’ll need to identify the code that’s causing the high CPU usage in the worker process.
However, if you want this effort to have real benefit, there are several important factors to consider.
First, you’ll need to do this IN PRODUCTION with real traffic, otherwise you run a very real risk of optimizing the wrong code (the code that shows up during testing is not necessarily the same as the one causing CPU issues in production.
Second, you’ll need to do this at the RIGHT TIME, specifically at the time when the IIS worker process CPU usage is high AND when your website performance is degraded. Otherwise, you will not be able to spot the code that’s causing the inelastic benefit, or end up optimizing the wrong code.
It turns out that doing both is not as easy as it seems.
The difficulty of diagnosing CPU usage in production
Developers are used to excellent tools for CPU profiling in development and test environments, including Visual Studio, ANTS Performance Profiler, and so forth. These tools provide the ability to measure the CPU cost of every function call in the application being profiled.
Unfortunately, these tools are not normally available in production, and for good reason! Profiling introduces a high level of overhead which is not suitable for production environments.
Since you cannot profile a production process continuously, what about profiling only when there is a performance problem? That’s not really feasible either, because attaching a profiler requires a process restart, which can be problematic in production (and can remove the very performance problem we are trying to catch). Also, catching CPU problems in production is not easy as we’ve discussed above.
To solve this problem, we had to develop an approach we call “Just in time” CPU diagnostics.
Just-in-time CPU diagnostics
The approach solves both the timing and production overhead issues for CPU profiling as follows:
- During normal operation, LeanSentry monitors the IIS worker process using Windows performance counters and IIS logs.
(Because it attaches no profilers or debuggers to your IIS worker process, there is zero performance impact.)
- When high CPU usage is detected, AND website is having performance degradation, LeanSentry makes a decision as to whether CPU analysis is desired.
(If we recently performed analysis, or if the issue is not significant given prior statistical history, no analysis is performed.
- If analysis is desired, LeanSentry performs a short CPU analysis using a low-impact method.
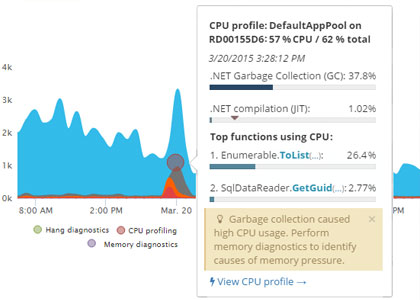 LeanSentry diagnosing IIS worker process CPU usage during a CPU overload impacting website performance.
As a result, there is zero performance overhead on average, with a few very short analysis periods at the exact time of performance degradation that produce code level information on the offending code.
Lightweight CPU profiling with ETW events
LeanSentry uses a non-attaching, non-blocking CPU profiling method based on background ETW events emitted by the IIS worker process. This approach has no impact on website performance because it does not block request processing, as compared to the regular profiler attach approach.
This process happens infrequently and lasts only 30 seconds, further minimizing any monitoring overhead to the server CPU usage.
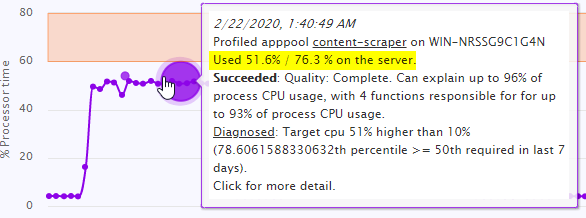
When the profiling completes, LeanSentry CPU diagnostics analyzes the ETW events and produces a diagnostic report identifying the application code that caused the worker process CPU usage:
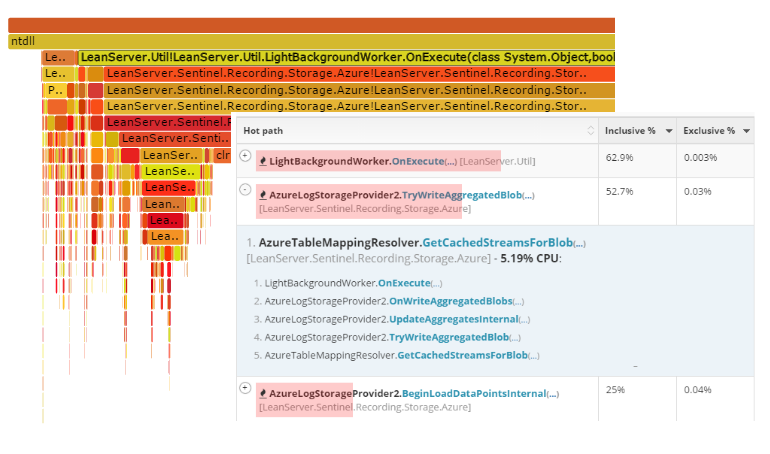
If you don’t have LeanSentry, you can mimic our approach by using PerfView.exe, an open-source Microsoft performance tool written by Vance Morrison. PerfView is a great tool with very powerful capabilities, but you’d need to be logged into the server, and manage the timing of the analysis yourself. Reading the results can also be a bit complicated:
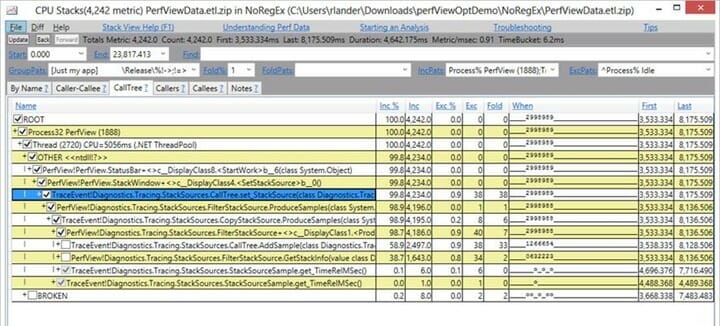
You can learn how to profile CPU usage using PerfView here.
Diagnosing CPU overload with a debugger
In cases where the server CPU is completely overloaded, the ETW profiling approach may fail to generate good results. This happens because ETW is fundamentally designed to be a lossy system to maintain low tracing overhead. As such, ETW automatically drops events if the system is overloaded. If the trace loss is high enough, an ETW profiler will not be able to properly construct stack traces needed to tie the CPU usage down to code.
LeanSentry implements a secondary mechanism to help diagnose CPU usage in cases of complete overload, which uses a debugger instead of a profiler.
The idea is simple: if the IIS worker process is using so much CPU that the server is completely overloaded, you are able to clearly identify the functions causing the CPU usage simply by viewing a point-in-time snapshot of the executing code.
(Meaning, we don’t need to profile the CPU usage of the process as it executes, but simply look for the threads with the highest CPU cost at a single point in time.)
LeanSentry goes a step further though, and performs a “differential” snapshot of the process by taking a thread stack snapshot, resuming the process for 100-200ms, and then taking a second snapshot. We then compile the results into the code pathways that are responsible for the CPU overload:
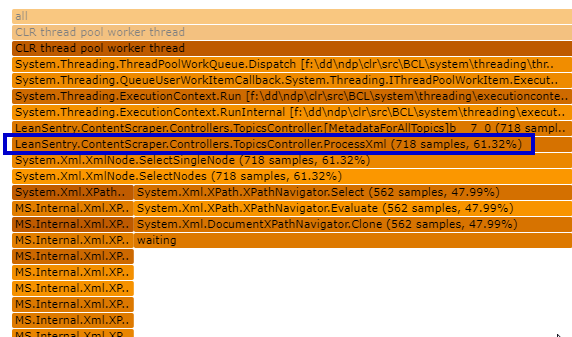
The CPU diagnostic automatically identifies the code causing CPU usage by looking for:
- Threads with high CPU cycle delta during the 200ms snapshot (running CPU-intensive code).
- Code executing on many threads (high concurrency CPU overload, or code that’s a CPU bottleneck)
(For a quick how-to on optimizing high CPU usage, see Diagnose w3wp.exe high CPU usage with LeanSentry.)
If you don’t have LeanSentry, and are OK with a bit of analysis work, you can perform a simple version of this analysis yourself using the approach below:
However, keep in mind that this approach has a high rate of failure, since you are likely operating on a server that has an overloaded CPU. In many cases, you may not be able to RDP into the server in this state, or be unable to catch the process in the high CPU state at the right time. It’s probably taken us close to 5 years to perfect this approach as part of LeanSentry CPU diagnostics.
- Make sure Windows debugging tools are installed on your server.
- Wait for the IIS worker process to exhibit high CPU.
- Attach the debugger to the worker process:
ntsd -p <w3wp.exe PID>
- Make sure the right symbols and SOS.dll CLR debugging extension is loaded. This is different for different versions of the .NET framework, but here is a simple version:
.symfix
.reload
.loadby sos clr
- Start logging the output to a log file:
.logopen c:\cpu-debug.log
- Snapshot the thread timings.
!runaway 3
This will output something like this:
 User Mode Time
  Thread       Time
   32:4708     0 days 0:00:14.390
   35:49b4     0 days 0:00:13.203
   30:3f2c     0 days 0:00:12.093
   37:3208     0 days 0:00:11.796
   34:2064     0 days 0:00:11.796

...
- Snapshot the thread stack traces.
~*e!clrstack
This will dump out the .NET stack traces of all threads, looking something like this:
OS Thread Id: 0x13494 (528) Child SP IP Call Site 000000bba036d070 00007ffa6b310cba [GCFrame: 000000bba036d070] 000000bba036d198 00007ffa6b310cba [HelperMethodFrame_1OBJ: 000000bba036d198] System.Threading.Monitor.ObjWait(Boolean, Int32, System.Object) 000000bba036d2b0 00007ffa58c30d64 System.Threading.ManualResetEventSlim.Wait(Int32, System.Threading.CancellationToken) 000000bba036d340 00007ffa58c2b4bb System.Threading.Tasks.Task.SpinThenBlockingWait(Int32, System.Threading.CancellationToken) 000000bba036d3b0 00007ffa595701d1 System.Threading.Tasks.Task.InternalWait(Int32, System.Threading.CancellationToken) 000000bba036d480 00007ffa5963f8d7 System.Threading.Tasks.Task`1[[System.Boolean, mscorlib]].GetResultCore(Boolean) ... - Resume the process for a very, very short time by pressing “Control-C” a second after pressing Enter on the resume command:
g
- Repeat steps 6 & 7 to capture another thread snapshot.
- Detach from the process
.detach;qq;
Once you’ve done this, you are in for some analysis work on the log file you’ve collected. Look for the following:
- Stacks that are showing up on most of the executing threads. If a single stack appears on most of the threads, that is likely the cause of the CPU overload*.
- Compare the CPU timing delta in the !runaway command between the first and the second snapshot (grouped by thread id). If a single thread or a few threads have a very high delta compared to the rest, look for their stack traces. They will likely represent a CPU intensive portion of the code that’s causing the CPU usage.
*Make sure to filter to the threads whose stack traces represent CPU-executing code, as opposed to code that’s blocked in a wait state. LeanSentry has a complex filter to detect blocking vs. executing code. This can be tricky to do manually if you don’t have experience with debugging, but to keep it simple, you want to exclude anything that’s ending in “WaitForSingleObject”, “Thread.Sleep”, and so on.
If you are using LeanSentry, the CPU diagnostic report makes this analysis simple for you, by showing you a merged tree of the application code by its CPU usage. You can drill into the tree to visually navigate the code pathways contributing the most CPU usage:

It’s basically as simple as visually spotting the “thickest” trunks of the CPU tree, and exploring them to find the right level (right code function in your app code) to optimize at.
Optimizing the code
Once you know which code is causing high CPU usage, optimizing it should be relatively straightforward (for a developer familiar with the code).
(Because of how large this guide ended up, I decided not to spend much time discussing the optimization code work itself. If you’d like me to cover this area in more detail, please shoot me a request in comments below.)
That said, our experience with CPU optimizations for thousands of IIS websites brings me back to the “secret” I shared at the beginning of this guide:
The actual cause of high CPU usage in production is almost always NOT what you think it is!
More specifically, instead of the CPU usage being caused by some fundamental processing aspect of the application, it is usually caused by something “silly” like a logging library logging too many errors to a logfile, an overactive lock with high contention, and so on.
(This also explains why most CPU overloads are missed during testing.)
As a result, once you see the actual code causing the CPU usage, the fix is usually easy … something like removing it or changing the code slightly to avoid the situation altogether.
If the CPU usage is indeed due to a critical portion of the code, it’s time to put on your optimization hat. We normally find that most CPU optimizations use one of two approaches:
- Top-down: if a toplevel function causes a lot of CPU usage as a sum of many different child pathways, the best approach is to reduce the frequency of the high level call or eliminate it if possible (e.g. via caching). This can be an incredibly simple, and incredibly effective approach that does not require any code optimization.
- Bottom-up: If most of the CPU usage is due to a “leaf” function like GZIP compression, JSON serialization, and so on, you’ll need to optimize that code or explore alternatives that have a lower CPU cost.
As a developer, I personally love the bottom up cases, because they give me an opportunity to fire up Linqpad and test out some creative code optimization ideas. For example, if you are using JSON serialization to store some data, and that causes high CPU overhead, you can test out a more efficient serialization scheme like protobuf-net by Marc Gravell.
In LeanSentry itself, we’ve implemented our own byte-level serialization in specific cases that’s ~10x faster than JSON, and 2-3x faster than protobuf-net for specific use cases on our critical path.
But, in all other places, we use protobuf-net.
This brings me to the other important benefit of only doing CPU optimization based on production CPU diagnostics …
You only need to optimize the code that’s actively causing CPU problems!
There is no point optimizing the other 99% of your application code that’s not actually causing high CPU in your real production workload. If it ain’t broke …
Conclusion
High CPU usage in the IIS worker process, and server CPU overloads, are the second most common performance issue for IIS websites.
Yet, many teams struggle to fix and prevent CPU overloads in production, sometimes despite committing substantial development time and resources to performance testing and tuning.
In our experience of helping solve performance issues for 30K+ IIS websites in the last decade, this comes down to one thing and one thing only: being able to diagnose the CPU usage of the production website AT THE RIGHT TIME (when it’s having performance issues).
In this guide, I outlined the entire process we use at LeanSentry to resolve CPU issues in IIS websites:
- How high CPU usage can cause secondary performance bottlenecks in IIS websites (aka. “inelastic workload”), because of thread pool starvation, task contention, timeouts, wasted processing, and so on.
- How to reliably detect high CPU usage in the IIS worker process (that actually matters to your website performance).
- How to diagnose high CPU usage down to application code causing it (using ETW profiling and/or debugging).
- Approaches to do CPU code optimization.
If you are having high CPU issues, and are looking for a fast way to resolve them correctly, check out LeanSentry CPU diagnostics. This can dramatically simplify the process of catching and diagnosing CPU usage problems for your website, without the traditional overhead associated with profiling in production.
My final recommendation is to first focus on making your application elastic, so that it does not hang/stutter under high CPU usage. Then, use the CPU diagnostics to incrementally optimize it to increase website performance and lower hosting costs.
This approach is key to preventing future performance issues when the CPU goes high, so your optimization efforts can be about yielding proactive improvements as opposed to high stress reactions to severe production incidents.
