
The IIS thread pool plays an important role in enabling IIS websites to deliver high performance for large web workloads. Like any thread pool, the IIS thread pool is susceptible to thread pool exhaustion (hitting the thread limit), and thread pool starvation (not having enough threads in the moment to handle the incoming requests).
These issues can negatively affect your website performance.
But probably not in the way you think!
In this guide, we’ll dig into how the IIS thread really works, and how that relates to common performance issues. We’ll also look at specific causes of IIS thread pool exhaustion, and effective ways to solve them.
Finally, we’ll break down the IIS thread pool algorithm, and the IIS thread pool settings you might (and might not) change to tune it to your workload.
What is the IIS thread pool
The IIS thread pool maintains the threads designed to rapidly dequeue requests from the application pool queue, and process them inside the IIS worker process.
Like all thread pools, it limits how many threads can be created and how fast they are created. As a result, if all the IIS threads are busy, this thread pool can become exhausted, which can lead to performance problems.
That said, the actual reasons for IIS thread pool exhaustion, and the actual problems arising from it, are not what most people think they are.
How the IIS thread pool works
Before we dig deeper, let’s take a look at how IIS thread pool works.
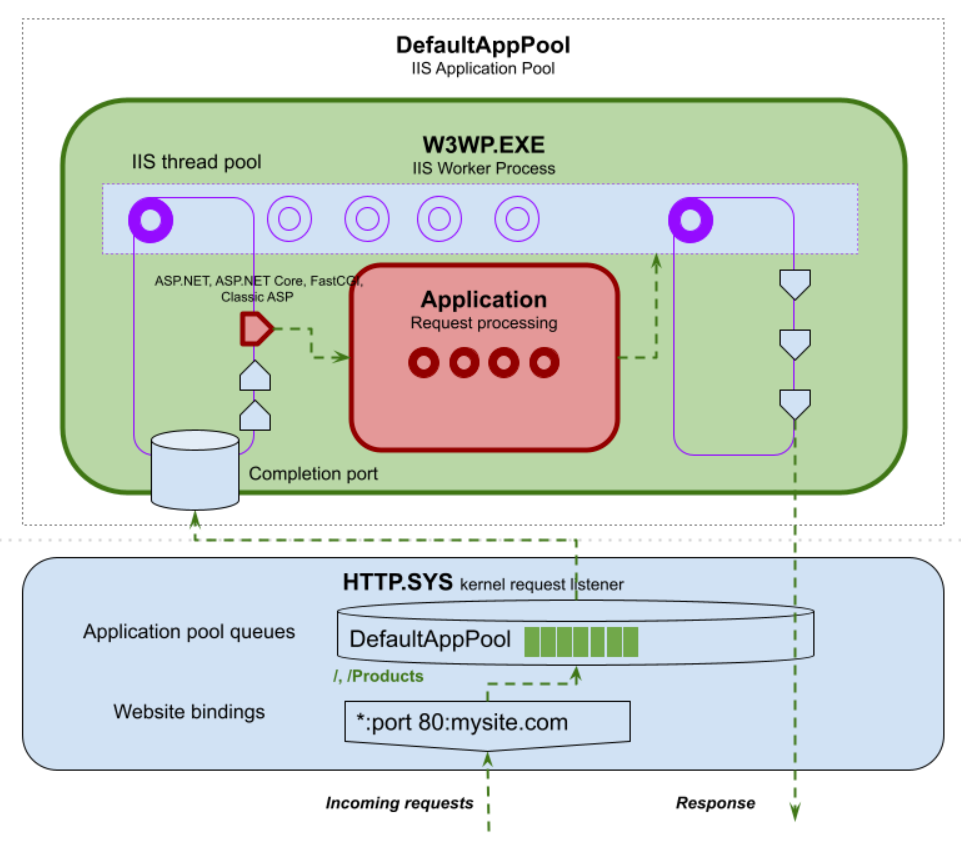
When the worker process first starts, it will create a minimum number of IIS threads in the IIS thread pool. These threads will then:
- Receive requests from the application pool queue.
- Set up the request “state machine” (instantiate the request objects, and retrieve the necessary configuration for the request URL).
- Execute the request pipeline (invoking modules registered for each pipeline stage, e.g. BeginRequest, AuthenticateRequest, etc).
NOTE: Most of the “actual” request processing takes place on the application threads, as we’ll see below. - Flush the response at the end of the request.
For a simple static file workload, the entire request may be processed on a single IIS thread (ignoring any asynchronous switches for the moment).
However, the reality is, that most website functionality is implemented through an application framework like ASP.NET, ASP.NET core, Classic ASP, PHP (via FastCGI), and so on.
Most application request processing is done on application thread pool threads, such as the CLR thread pool for ASP.NET and ASP.NET Core requests, Classic ASP thread pool for ASP scripts, etc.
As a result, IIS threads do minimal request processing and almost never block.
Request processing almost always moves to an application thread pool
For most applications, the bulk of the request processing will NOT take place on IIS threads. Instead, the very first thing that the application framework module (like webengine.dll for ASP.NET, AspNetCoreModule, asp.dll, or FastCGI) will do is queue the processing to its own thread pool.
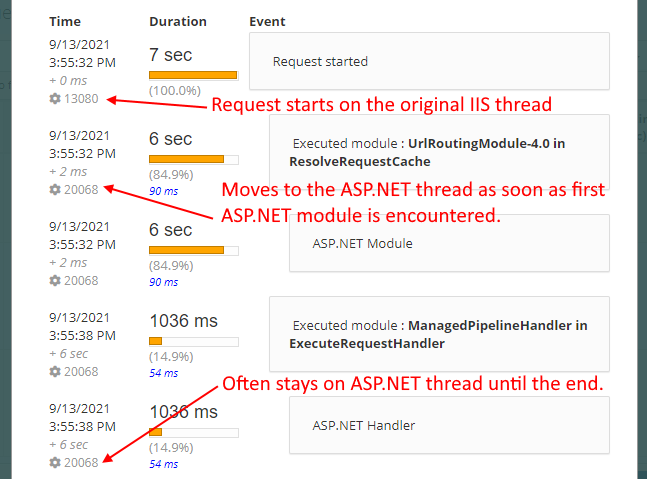
For example, the CLR thread pool for ASP.NET. When IIS encounters any ASP.NET module, including the handler that executes your MVC controller actions, WebAPI actions, or legacy ASPX pages, it queues the request processing to the CLR thread pool where CLR worker threads pick it up to execute the application logic.
The application code then executes on application thread pool threads, and the IIS thread is released back into the IIS thread pool to pick up the next request.
History of ASP.NET thread switching in IIS
In the old days, this would happen whenever the request processing pipeline got the "ExecuteRequestHandler" stage, i.e. the stage where the application logic for handling the request and creating a response.
In fact, before we built the Integrated Pipeline in IIS 7.0, ASP.NET request processing was implemented by ASPNET_ISAPI.dll, which was effectively registered for the Execute Handler stage. As a result, you could not use the ASP.NET pipeline to extend any of the other parts of IIS request processing like authentication, authorization, or caching.
With the Integrated mode (default in IIS 7.0+), the ASP.NET pipeline became overlaid with the IIS pipeline, so you could register ASP.NET modules to run in pretty much every IIS pipeline stage. As a result, most request processing would now happen on CLR worker threads, because the request would get queued to the CLR thread pool as soon as the first .NET module was encountered in the pipeline.
For performance reasons, request processing would then continue on the CLR thread, even for IIS modules, until potentially the very end of the request. Instead of returning control back to IIS after an ASP.NET module finished, the ASP.NET engine would "pull" any subsequent IIS module notifications and execute them inline. This allowed us to avoid the cost of re-entering managed code later, and meet the stringent performance criteria required by the Windows org to ship the Integrated pipeline.
As a result, the switch from the IIS thread to the ASP.NET CLR worker thread now happens much earlier, and most of the request processing (including IIS modules later in the pipeline) stays on the CLR thread instead.
For a detailed writeup on IIS and ASP.NET threading, check out Thomas Marquardt's detailed blog post (Thomas was the lead developer on the ASP.NET Integrated Pipeline and helped us jump through all the narrow performance hoops we needed to).
Monitoring IIS thread pool performance
IIS threads perform so little processing compared to the application, that they are almost “invisible” in most workloads.
In fact, IIS threads almost never block in modern applications.
Because long-running or thread blocking operations happen inside application code, they block the application thread instead, not the IIS thread. So, while it’s very common to experience hangs due to starvation of the CLR thread pool, this has nothing to do with the IIS thread pool at all.
That said, there are very specific cases where the IIS thread pool may become exhausted, experience threadpool starvation, or encounter other performance issues that will hurt your performance.
Thankfully, these cases are very easy to recognize, if you know where to look.
IIS thread pool exhaustion
Because IIS threads are responsible for dequeueing requests from the application pool queue, the primary effect of IIS thread pool exhaustion is … a growing application pool queue!
You can observe this with the following counters:
- HTTP Service Request Queues\CurrentQueueSize (<pool_name>): the number of requests currently in the application pool queue
- HTTP Service Request Queues\RejectedRequests(<pool_name>): the total number of requests rejected (likely due to 503/queue full*)
- W3SVC_W3WP\Active Threads Count (<pid>_<pool_name>): the number of IIS threads in the specific IIS worker process.
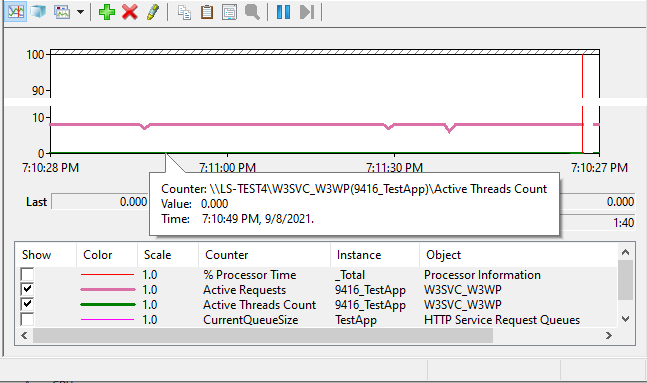
You may have IIS thread pool starvation, or thread pool exhaustion, if:
- You have a non-zero application pool queue,
AND - The number of active threads in the worker process (“Active Thread Count” counter) is greater than zero.
If the number of active threads is greater than 0, you may have thread blockage. If the number is large, it’s likely that you may be experiencing thread pool starvation. Thread pool starvation is simply inability of the thread pool to grow quickly enough to provide additional threads needed by your workload.
If the number is greater than the IIS max threads setting, your worker process has reached the IIS thread pool limit on threads and is experiencing thread pool exhaustion.
(IIS thread pool exhaustion is VERY unlikely because IIS threads almost never block)
*Note that requests may be rejected with a 503 response due to other application pool failures, including an application pool that has been disabled or taken offline due to repeated crashes. The latter may be triggered by the IIS Rapid Fail Protection feature.
We’ll get into the logic for determining the underlying causes of IIS threadpool exhaustion next.
However, if you already have LeanSentry set up on the server for production diagnostics, then it will automatically alert you about significant 503 Queue Full incidents and other application pool failures:
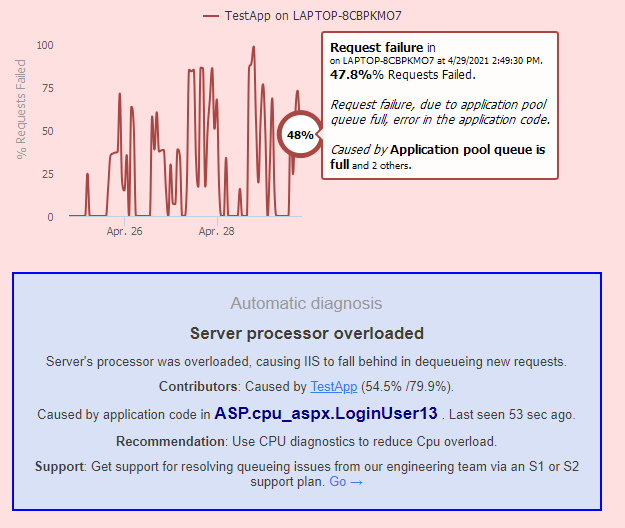
This includes the HARD work of determining the application code indirectly causing the queue, e.g. code blocking IIS threads or application code triggering CPU overload (which is in turn causing IIS threadpool starvation and queueing).
LeanSentry monitors poor IIS thread pool performance in the background, even if you don't have 503s, and performs diagnostics to help you proactively optimize your application:
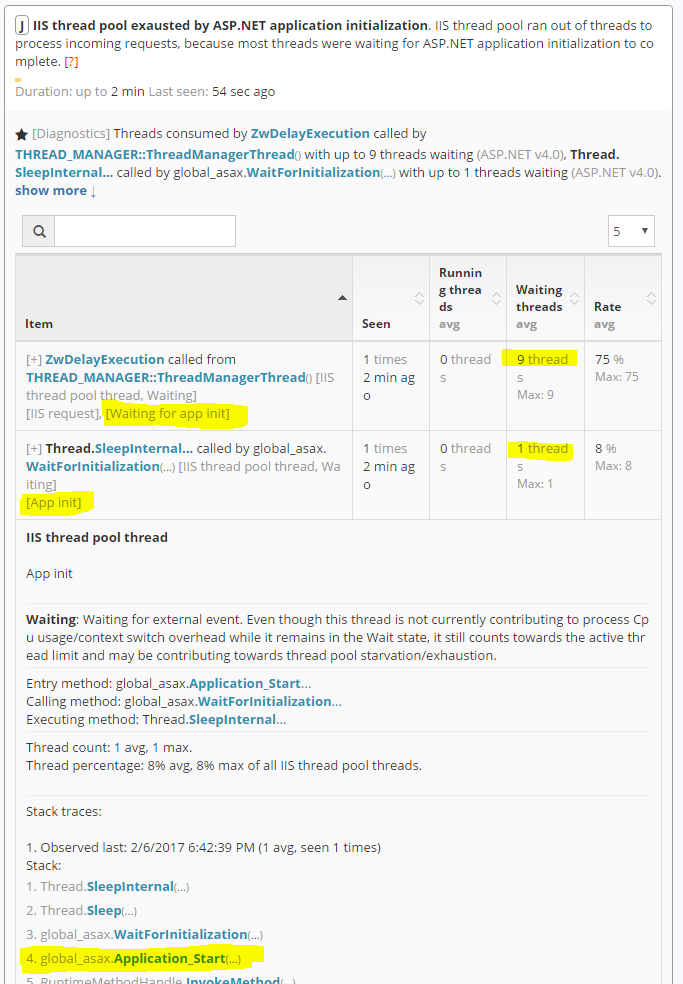
Without further ado, let’s get into the specific causes of IIS threadpool exhaustion, and how we can diagnose and fix them.
What causes IIS thread pool exhaustion
From diagnosing hangs and queueing for over 30,000+ IIS websites over the last 10 years, we can confidently say that IIS thread pool exhaustion has the following common causes:
- CPU overload
- Thread blockage due to application initialization
- Thread blockage due to slow file or network access
CPU overload causing thread pool starvation
When the server CPU is overloaded, the normally-fast tasks of dequeueing requests from the application pool queue, and processing IIS modules (e.g. dynamic compression) may take longer.
As a result, IIS will require more threads to continue dequeueing incoming requests.
You can detect this case as follows:
- Server has high processor queue: System\Processor Queue Length >= 10, or significantly higher than normal
AND/OR - Server has very high processor utilization: Processor\% Processor Time (_Total) performance counter >= 90%
AND - Many active IIS threads: WAS_W3WP\Active Threads Count (<pid>_<pool_name>) is greater than zero
What’s interesting in this case is that you do not necessarily want to have more threads in the system, when the CPU is already overloaded. Because the CPU cost of actually processing a request, especially in the application tier, is orders of magnitude greater than the cost of IIS request processing, injecting additional requests into the system will make the problem worse.
Therefore, the answer here is NOT to add more IIS threads. It’s also not to increase the IIS completion port concurrency (see the section on configuring the IIS thread pool).
Instead, you’ll want to address the CPU overload, by optimizing your application code to reduce it’s CPU usage.
If you have LeanSentry on your server, it will automatically identify the process/application pool causing CPU overload, and use CPU diagnostics to identify the code contributing to the CPU overload. You can then use the report to tune the offending code:
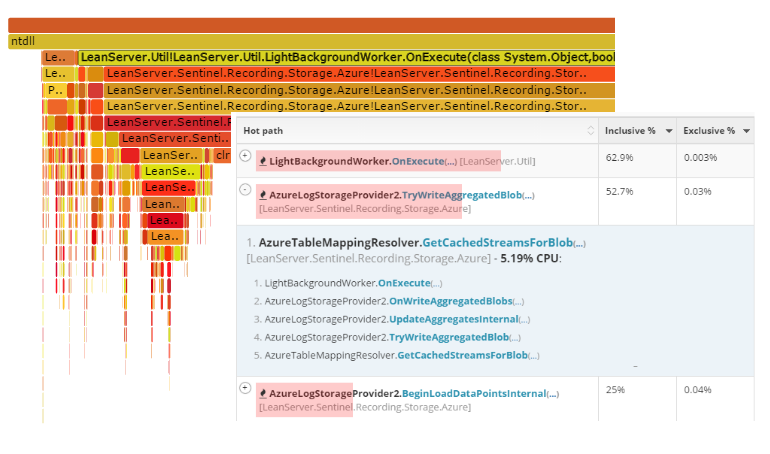
To fix 503 Queue full errors due to IIS pool starvation/CPU overload:
- Optimize the application code contributing to CPU overload. .
If you are desperate in the moment, you can also:
- Spin up more nodes (to share the workload better)
- Add CPU cores/increase CPU bandwidth.
IIS threads blocked in application initialization
When the ASP.NET application first starts, IIS threads processing requests to this application will become blocked on the application lock.
This can cause IIS thread pool exhaustion if the application takes a long time to start, e.g. due to a long-running data load or a network delay in Application_Start. If this happens during high traffic, hundreds of IIS threads can become blocked, causing IIS thread pool exhaustion, queueing, and 503/queue full issues.
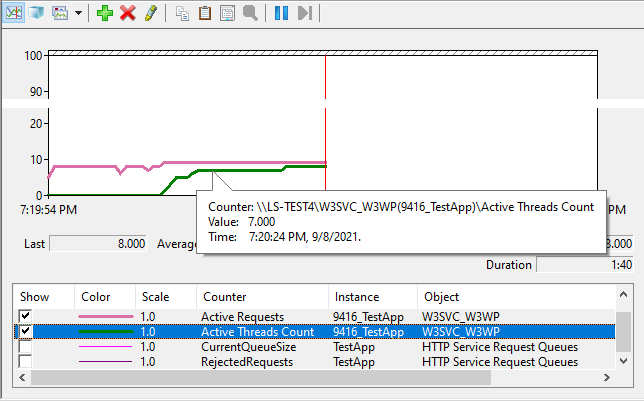
When application initialization takes place, you will observe the IIS active threads ramping up, up to the total number of concurrent requests to the application. IIS threads are now getting blocked!
If you have LeanSentry diagnosing your hangs for you, you can observe 1 IIS thread blocked in the ASP.NET application initialization pathway, and the other IIS threads blocking in W3_CONTEXT::SetupStateMachine call (waiting for application initialization to complete):
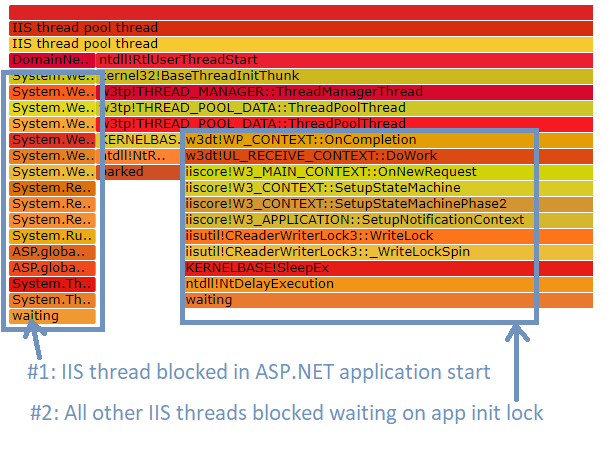
Here are the stack traces of both:
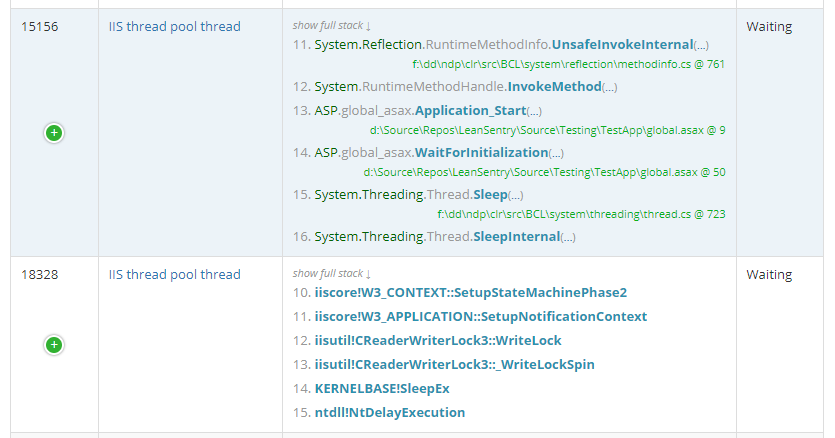
If you are recycling or restarting your application in production to deal with a performance problem such as a hang or a memory leak, you can then inadvertently trigger IIS thread pool starvation and a 503/queueing outage.
The best answer here is to resolve the underlying hang or memory issue, so it does not recur, instead of using restarts as a band-aid. If you have LeanSentry, you can use Hang diagnostics or Memory diagnostics to catch and diagnose issues in your production website.
To further mitigate impact of undesired restarts in production, be sure to use the correct restart method (overlapped recycling) + a resilient application warmup implementation. You can read about both in our comprehensive Reset, Restart, Recycle IIS guide.
IIS threads blocked by slow network access
When the request is first received, the IIS thread will perform “request setup” which includes:
- Retrieving the web.config configuration for the requested URL
- Accessing information about the file being requested
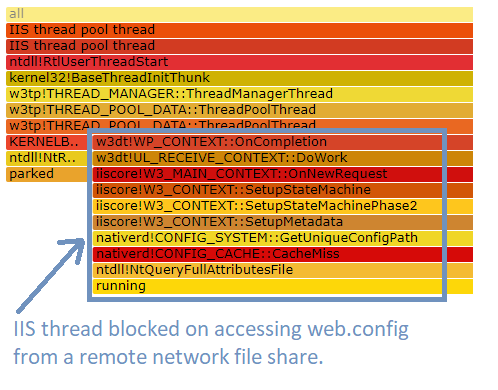
If the request application files are on a network device, instead of local to the server, there is the possibility that this network lookup may block. This can happen if the network file storage device is overloaded, or if there is a network delay in accessing it.
In this case, the IIS thread can become blocked, causing thread pool exhaustion. In this case, the IIS threads will be blocked in W3_CONTEXT::SetupStateMachine like this (using the thread graph from the LeanSentry hang diagnostic):
To resolve this issue, you can try:
- Move the application files to the local server file system (instead of a remote file share)
- Eliminate network outages that may cause prolonged delays in accessing the files on the network share.
- Reduce load on the network file device (e.g. by reducing outstanding file change notifications).
When to increase the IIS thread limit
You can configure the IIS thread pool to control the maximum number of threads it can create, as well as the default number of threads IIS creates when the worker process starts.
Note that this configuration has ZERO effect on the application threads that perform the bulk of the request processing, as we learned above. As a result, any thread pool exhaustion hangs will not be improved by increasing the number of IIS threads.
If you are using LeanSentry, you can confirm whether the IIS thread pool is running out of threads. LeanSentry hang diagnostic reports map out IIS threads and ASP.NET threads (as well as any async tasks) to determine where the hang is taking place. If the hang diagnostic report identifies thread pool exhaustion, you can visually see it in the Thread Analysis view of the report:
- If you have IIS thread pool exhaustion, you will have 0 “parked” IIS threads, and all the available IIS threads will be running or waiting.
- If you have ASP.NET thread pool exhaustion (CLR worker thread exhaustion), you’ll see all available CLR worker threads waiting or running, with 0 threads parked:
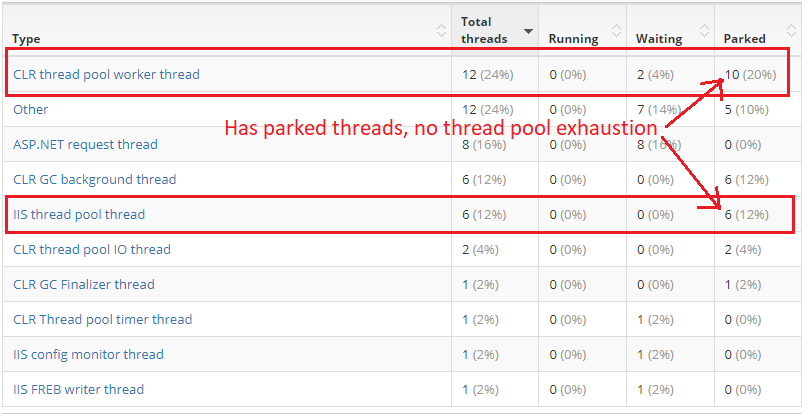
So, if you have parked (available) IIS threads, you do not have IIS thread pool exhaustion and will likely not benefit from increasing the number of IIS threads available.
Even if you have blocked IIS threads in the cases mentioned earlier, you are always better off resolving the underlying cause of blockage than increasing IIS max threads.
In my opinion, increasing the IIS thread pool size is ALMOST never necessary. But, you may consider doing it in these very specific circumstances:
- Your server has a high RPS, and gets hit with bursts of traffic that cause application pool queueing/503 errors (but without overwhelming your CPU). You may benefit from a larger initial IIS thread pool size, so that you can dequeue the bursting requests faster.
- You have temporary IIS thread pool blockages due to application initialization or network file access, that resolve after a few seconds. Increasing the IIS thread pool size may help you cope with these temporary snags.
We’ll next look into the specific methods for configuring the IIS thread pool.
IIS thread pool configuration
To change how the IIS thread pool works, and how many threads it provides for your workload, you can modify a number of registry values under the registry key HKLM\System\CurrentControlSet\Services\InetInfo\Parameters.
Here are all the registry keys you can modify to control the thread pool:
| Registry value | Default |
| MaxPoolThreads
The configured maximum number of threads (per processor) in the IIS thread pool. Note that the thread pool has a hard limit of PoolThreadLimit below which is 256 threads at most. More details here. |
20 * number of processor cores |
| PoolThreadLimit
The “hard” limit on the max number of threads in the IIS thread pool. This limit can be set to a value between 64 and 256, so you cannot have more than 256 IIS threads in the pool regardless of settings. More details here. |
Depends on available memory. |
| ThreadTimeout
The time after which an unused IIS thread is removed from the pool. More here. |
1800 seconds |
| ThreadPoolStartupThreadCount
The number of threads the IIS worker process creates at startup. |
1 * number processor cores, minimum of 4. |
| ThreadPoolMaxCPU
IIS does not create thread pool threads if the CPU usage on the server exceeds this value. |
95% |
| ThreadPoolStartDelay
IIS waits this amount of time before creating each new thread pool thread. More details here. |
1 second |
| ThreadPoolExactThreadCount
If set to 1, configures the IIS worker process to start this many threads, instead of using the default thread algorithm. |
0 (disabled) |
| MaxConcurrency
The number of IIS threads that are allowed to concurrently pick up requests from the completion port. More here. |
0 (number of processor cores) |
The thread pool creates ThreadPoolStartupThreadCount (1 * number of processor cores by default) threads at worker process start. Then, if all the threads are busy picking up requests or performing other request processing tasks, the thread pool creates 1 thread every ThreadPoolStartDelay seconds (1 second by default). This continues up to the limit of MaxPoolThreads * number of processor cores (20 * processor cores by default), or until the hard limit of PoolThreadLimit is reached.
If there are more threads than is needed, IIS will remove a thread after ThreadTimeout (1800 seconds by default).
I would normally consider the following optimizations:
- If you are hitting thread pool exhaustion, you can raise the limit by increasing MaxPoolThreads (per processor), and PoolThreadLimit (the absolute hard limit).
- If you are encountering thread pool starvation, meaning IIS does not create threads fast enough to handle a temporary spike in requests, you can raise ThreadPoolStartupThreadCount to have more threads right away.
- RARE: If you run a very high RPS workload, AND your IIS threads become blocked (e.g. due to a custom IIS module that blocks the thread for a short time), you may consider increasing MaxConcurrency to allow more than 1 thread/processor to dequeue incoming requests. This is an extremely rare case … I have not seen this in production personally outside of ScaleUP, our custom async upload engine.
NOTE: Be sure to recycle any application pool on the server to effect these settings for it’s worker processes (IIS does not automatically pick up changes to the registry keys).
A note on thread contention
Thread contention is the negative effect of having too many threads in the system. It’s basically the other side of the thread pool exhaustion coin.
To execute threads, the system must context switch between them, and this context switching introduces CPU and memory overhead.
This is why IIS by default will only allow 1 thread per processor core to actively dequeue requests (that MaxConcurrency setting). In a CPU-bound workload, having more threads does not result in a higher RPS, but lower RPS instead because more of the processor bandwidth is spent context switching.
More threads only benefit if threads are becoming blocked by waits or blocking IO, which does not typically happen for IIS threads.
Conclusion
In conclusion, IIS thread pool exhaustion is rare.
IIS threads almost never block, especially in modern application workloads, and therefore any hang or slow requests you may experience will usually not benefit from increasing the IIS thread pool.
If you are experiencing hangs or poor performance, it’s more likely caused by application-level thread blockage.
To confirm this and identify the code causing it, you’ll need to analyze the hang in the application during the slowdown. The simplest way to do this is to use LeanSentry Hang diagnostics. You can also use dump analysis in a debugger if you are lucky enough to “catch” the hang on the server. For more on that, see our Diagnosing IIS and ASP.NET hangs guide.
If your application experiences application pool queueing, and 503 Queue Full errors, then you may have an issue with the IIS thread pool. We’ve covered the common causes of IIS thread pool exhaustion that cause queueing in this guide, and provided typical solutions.
These solutions almost never involve increasing the number of IIS threads, but rather resolving the underlying issues causing IIS thread blockage.
I hope this guide dispels some of the common misconceptions about the IIS thread pool, and helps you keep your website running smoothly.
