
Fixing .NET application memory leaks and garbage collection overhead is not easy to begin with. But it’s 10 times harder in production.
Unfortunately, based on our experience of troubleshooting 30K IIS websites with LeanSentry, most memory leaks happen in production only.
(The reason for this, as with most other production issues, is that memory leaks often require real production traffic to trigger.)
At the same time, .NET memory profiling in production has historically been a no-go, due to the incredible amount of overhead associated with the memory profiling tools.
Because of this, most teams ignore memory leaks as long as possible. When they become problematic, many will implement band-aid measures such as recycling the application pool when the leak gets bad. Or, running the application on larger VMs with 2x or 4x the memory than the application "normally" needs.
Fixing w3wp.exe memory leaks
We created LeanSentry Memory diagnostics to help you definitively resolve IIS and ASP.NET memory leaks.
In this how-to, we’ll look at the step by step process of detecting, and diagnosing production IIS memory leaks with LeanSentry Memory diagnostics. You can use this process to improve your IIS memory usage, to reduce recycling and hosting costs, and reduce GC overhead to significantly improve your website performance.
The cost of high memory usage
It turns out that memory leaks are the primary driver of increased cloud costs. This happens because unlike CPU power which can be scaled up or down based on load, memory size is static.
So, if your application normally uses 8Gb of RAM but occasionally leaks to 25Gb, you’ll likely need to run your entire workload on 32Gb VMs. Often-times at 4x the cost.
The impact of garbage collection
The dark side of inefficient memory allocation is garbage collection overhead. We routinely see .NET applications that have 40-60% Time in GC in production, which can translate to more than half of the available CPU bandwidth being consumed by cleaning dead .NET objects.
What’s worse, high GC overhead can lead to hangs, due to the impact on the CLR thread pool (the thread pool does not grow when GC is in-progress) and the thread suspension that happens during some types of collections.
Needless to say, high GC overhead can bring a .NET application’s performance to its knees.
Detecting IIS worker process memory leaks with LeanSentry
LeanSentry monitors IIS memory usage for each application pool, just like it monitors hangs, CPU usage, crashes, and so forth.
(This lightweight monitoring primarily uses performance counters and introduces zero overhead on your server.)
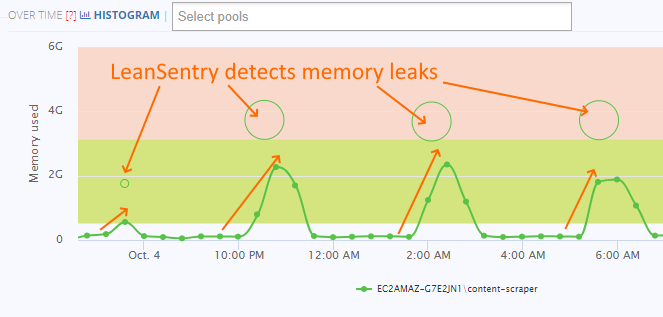
To view the memory leaks, select the website in the main website list, and go to the “Memory diagnostics” tab:


View memory diagnostic reports
You can then view the memory leaks detected by LeanSentry on the memory timeline graph, or in the table of memory diagnostic reports:
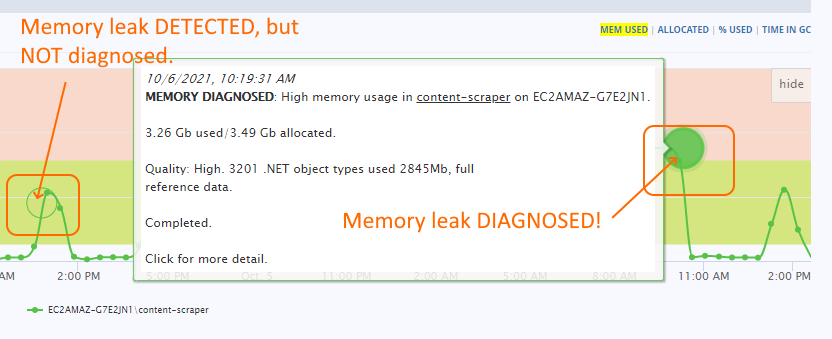
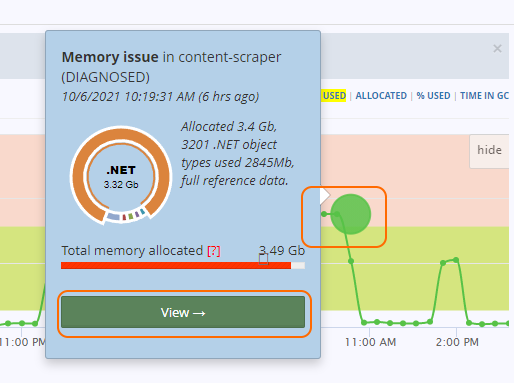
If LeanSentry chose to fully diagnose a memory leak, it will be shown as a filled in bubble. These "DIAGNOSED" reports are the ones you need to get the full details on your memory leaks.
LeanSentry will detect all memory leaks, excessive memory usage, and high Garbage collection overhead incidents but will not diagnose most of them to keep production diagnostic overhead low. These "detected" (not-diagnosed) reports will be shown as:
- Empty bubbles (outline only): LeanSentry did not diagnose this Memory incident because diagnostics are disabled or the incident was not important enough to diagnose.
- Yellow bubbles: LeanSentry could not diagnose because a diagnostic was already recently performed, or because we exceeded the allowable number of diagnostics for the day (diagnostic budget).
- Red bubbles: LeanSentry tried to diagnose but encountered an error.
These "detected" reports will contain basic information about memory usage, but WILL NOT contain detailed/code level analysis of the leak.
Next, we’ll look at how to enable full memory diagnostics to get the details you need to fix the leak.
dotnet.exe high memory usage
Some ASP.NET core applications use the out-of-process model, where the application code is hosted inside a separate dotnet.exe process instead of the IIS worker process. In this case, the memory leaks will take place in the dotnet.exe process instead.
To view dotnet.exe memory usage, click “Processes” page in your left-hand navigation menu, and find the dotnet.exe process in the process list to access its “Memory diagnostics” tab:

You can then enable memory diagnostics for the dotnet.exe process, and view memory incidents and diagnostic reports the same way you would for a website.
TIP: You can use the “Processes” page to diagnose CPU and memory usage for any process on your server.
Diagnose IIS memory usage with LeanSentry
LeanSentry uses the Just-In-Time diagnostic model, which enables it to continuously monitor/detect all common performance issues with virtually zero overhead to your server. It accomplishes this using public Windows server data sources like IIS logs and performance counters, and without attaching anything to your worker process that can affect its performance.
Memory diagnostics are disabled by default
Memory diagnostics are the only diagnostic not enabled by default. This is because unlike other diagnostics, including hangs, CPU, crashes, and many others, the memory analysis may take a bit longer.
During the analysis, your IIS worker process is paused in the debugger. If the analysis takes 20-30 seconds, this may be OK.
(Remember that full diagnostics are very rare due to diagnostic limits enforced by the diagnostic budget.)
However, for some applications, full .NET memory analysis may take several minutes, even 10 minutes for some applications. Because of this, we do not enable it by default, instead asking you to explicitly consider how to conduct it for your environment.
Enabling memory diagnostics
We normally recommend two strategies for memory diagnostics:
- Perform on-demand memory diagnostics + load balancer disconnect. This option provides the most control in a sensitive production environment where you want the smallest impact. It involves keeping memory diagnostics disabled, and triggering a full diagnostic on a specific server/application pool manually, immediately followed by detaching the server from the load balancer to minimize any additional traffic to the server during analysis. This option also allows the analysis to take as long as needed to obtain results.
- Enable automatic memory diagnostics. Appropriate in staging/test environments where the memory leak can be reproduced, or less-sensitive production environments. Here, you simply enable memory diagnostics with the desired memory thresholds and let LeanSentry diagnose the leak when it takes place.
On-demand memory diagnostics + load balancer disconnect
To perform an on-demand memory diagnostic, click the “Diagnose now” button on the “Memory diagnostics” tab for the desired website WHEN the memory leak is actively present.
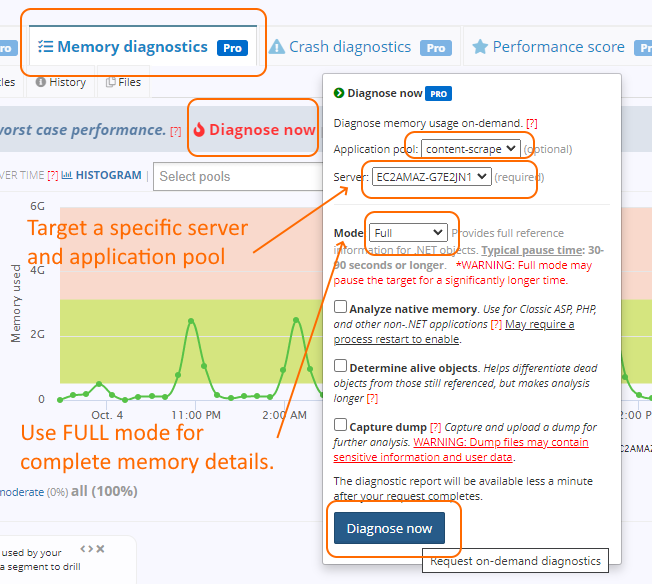
Be sure to:
- Select the correct server, and application pool for memory analysis. This is the pool that currently has the memory leak you want to diagnose (e.g. as shown on the timeline graph).
- Select the FULL mode for complete .NET object analysis, and reference graph showing where in the application the objects are coming from.
- If desired, you can also save a dump file of the IIS worker process, so you can perform advanced memory analysis after the fact.
As soon as the Memory diagnostic status bar says “In progress”, feel free to disconnect the server from the load balancer in order to minimize the production impact of the diagnostic due to the IIS worker process pause.
Enable automatic memory diagnostics
If you are less concerned with production impact, particularly in a staging/test environment where you are able to reproduce the memory leak, you can enable automatic memory diagnostics.
(Keep in mind that LeanSentry will still only diagnose your application once or twice a day at the most, depending on your diagnostic intent, the available diagnostic budget, and the overall diagnostic profile of your environment.)
To enable automatic memory diagnostics, open the “settings” in the “Memory diagnostics” tab and specify the memory thresholds at which LeanSentry should perform a full analysis:

You’ll need to:
- Enable memory diagnostics for this website (or application pool*)
- Set the minimum memory threshold (“after it allocates at least …”) after which leak may be diagnosed, and the absolute threshold (“as soon as it exceeds…”) after which LeanSentry will always attempt to diagnose if the budget allows.
- You can also target elevated Garbage collection by setting the Time in GC threshold (“garbage collection overhead exceeds …”) and the IIS worker process CPU utilization threshold (“application processor time exceeding ...”).
- Select the analysis mode. We recommend Lite** for a first run, to get a quick sense of the type of problem you are having AND get a sense of how long the analysis takes for your application, and Full** to get the maximum code details for fixing the memory leak.
*NOTE: You can use advanced settings on this page to focus diagnostics on a specific application pool. We recommend this when there are multiple application pools that may have elevated memory usage.
**NOTE: Lite analysis often takes 10-30 seconds, but depends heavily on the process memory size and allocation complexity. Full analysis usually takes 2-3x longer than Lite.
Selecting the right memory thresholds for your IIS worker process
Selecting the right memory threshold for analysis is very important. We recommend using the statistical history LeanSentry maintains for your application pool’s actual memory usage to determine the right thresholds.
To view the statistical history, select the “Histogram” option in the memory timeline graph:
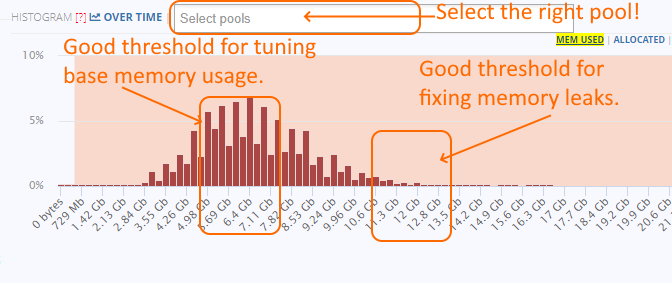
Here is how to use it to find the right threshold:
- Be sure to select the right application pool in the “select pools” filter to get accurate data.
- Use the “median” point in your histogram to optimize the “baseline” memory usage.
- Use the early tail end of your distribution to fix memory leaks.
The idea is that most applications have a “baseline” memory usage where their operation is normal, and a long tail which indicates a memory leak. You can diagnose early in the tail to speed up diagnostics, but still observe the pattern causing the leak.
If you diagnose the baseline, you won’t spot the “abnormal” or leaky usage pattern, but you can come up with ideas to reduce your “normal” memory usage.
Advanced: searching for specific high memory incidents
You can filter to Memory incidents in a number of ways:
- Select a server: by clicking the server in the left-hand server graph.
- Select a specific timeframe: by click-dragging on the % Processor Time timeline graph.
- Select a specific application pool: By using the “select pool” drop down select above the timeline graph.
- Select a Memory usage range: by selecting a range of memory usage on the histogram.

Additionally, you can sort reports by application pool memory usage, server memory usage, GC overhead, and diagnostic quality in the report table:

Determine cause of w3wp.exe high memory usage
To determine the cause of w3wp exe high memory usage for your application pool, locate a fully-diagnosed report and open it to view the memory leak details.
To open the report, click the filled-in bubble on the timeline graph, or find a high-quality diagnostic report in the “Reports” table:
Then, head over to the “Memory” tab of the report for a compositional breakdown of the memory usage of the IIS worker process during the analysis:
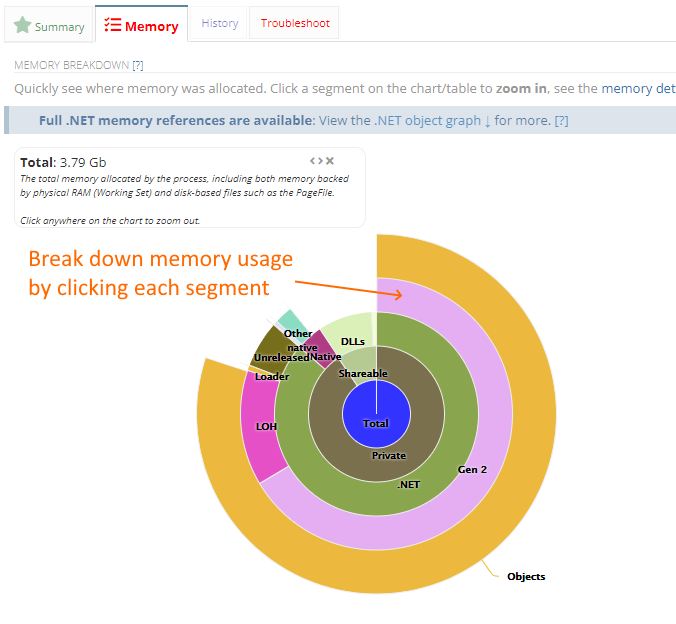
The memory composition is shown with concentric circles, each representing a 100% of the memory in the worker process:
- Total: the total memory allocated by the process.
- Shareable vs. Private:
- Shareable memory represents memory shared between multiple processes, and typically includes DLLs loaded by the process.
- Private memory is the memory the process itself allocated. You’ll almost always want to focus on Private memory when doing memory optimization.
- PRIVATE: .NET vs. Native:
- Native memory represents native allocations performed by windows, IIS, and the .NET framework. These further break down into Stacks (thread stacks), Heaps (malloc-style allocations), and Other (VirtualAlloc allocations e.g. IIS response buffers)*
- .NET memory represents memory occupied by your application objects, as well as special memory used by the CLR.
- .NET: managed heaps used by your application and the CLR:
- Gen0: The application objects that were just allocated.
- Gen1: The application objects that were recently allocated, and have survived 1 garbage collection. These could be long-living objects that got recently created, or short lived objects that are taking longer to get dereferenced.
- Gen2: Long lived objects, e.g. objects stored in a cache or referenced by long running operations.
- LOH: Large objects (>85000 bytes), like large byte arrays, strings, and large data collections.
- Loader: .NET assemblies loaded into your application.
- Unreleased: Memory that is not actively used by objects, but retained by the application e.g. due to large periodic allocation demands.
*LeanSentry can perform native memory diagnostics to get additional details about native heap allocations. Learn more about native memory diagnostics.
You can use this breakdown to diagnose a number of IIS memory usage problems:
IIS memory leaks
To diagnose IIS memory leaks, and tune IIS memory usage in general, you can focus on the “Native” memory group of the “Private” segment.
In particular, any high IIS memory usage will typically due:
- Large “Other” native allocations due to large responses being buffered, file cache, or extensive native output cache usage. You can further confirm these using IIS performance counters below.
- Large "Heap" allocations by native DLLs loaded by the application code. This is common with Classic ASP applications loading in-process COM objects like MSXML or ADO. This can be confirmed by enabling Native memory diagnostics in the LeanSentry Memory diagnostics settings.
To confirm IIS memory allocation as the main cause of w3wp.exe memory usage, check the following performance counters:
- \W3SVC_W3WP\Output Cache Current Memory Usage: The total bytes used by the output cache in the IIS worker process.
- \W3SVC_W3WP\Current File Cache Memory Usage: The memory usage by the IIS file cache.
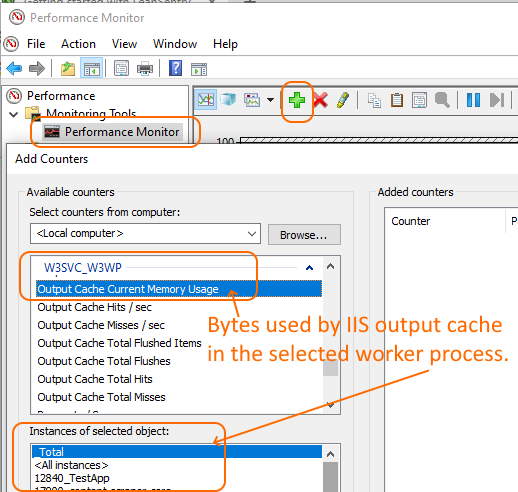
If neither of those counters explain high IIS memory usage in your w3wp process, the cause may be a large number of active requests sending large buffered responses. You can confirm this with the LeanSentry Performance score rule called “Response buffering”:

ASP.NET memory leaks
To diagnose c# memory leaks, or .NET memory leaks in general, you can can drill into the relevant .NET heaps to view the objects on those heaps:
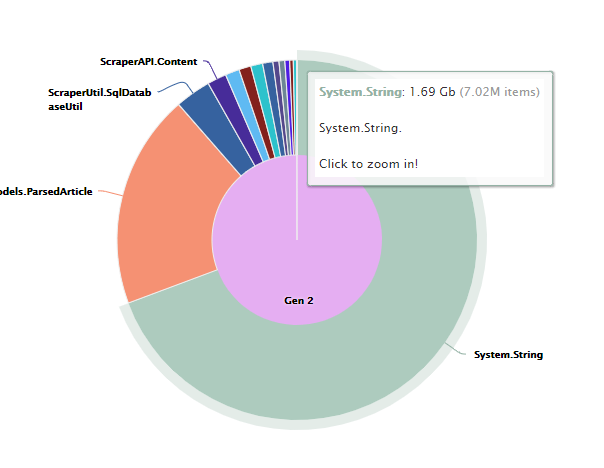
For example, this shows the bulk of the objects on the Gen2 heap are strings. Therefore, understanding where these strings are coming from can point out an opportunity to fix the memory leak, and/or reduce memory usage of the application.
You can click the “String” object on the pie chart to zero in on it. This brings us to the final part of the report, the .net memory reference graph! This graph shows us WHERE the objects you are focused on are being referenced from:
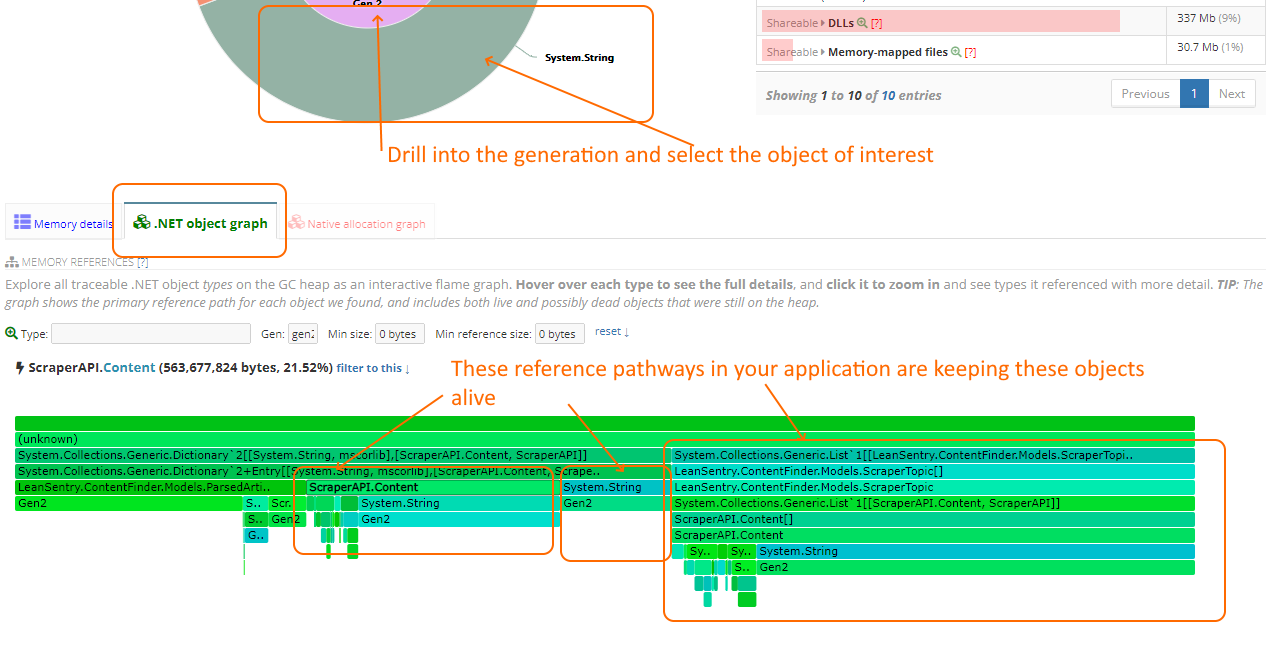
By identifying the .net objects causing the most memory usage, and how they are referenced by other .net types in your application, you can identify where in your application these objects are being used. To reduce memory usage, you’ll need to reduce the number/size of these objects or deference them to allow them to be garbage collected.
Fix .NET memory leaks using LeanSentry memory diagnostics
By using the LeanSentry memory diagnostic report, you can determine what causes your memory leak down to the objects in your application code.
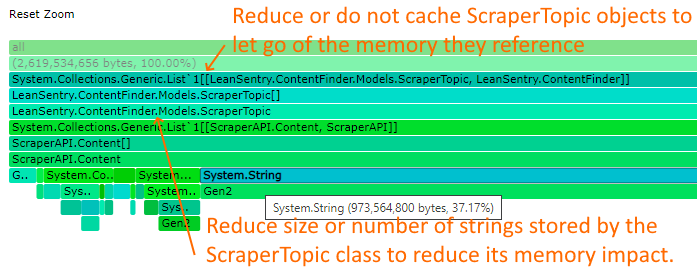
You can do this by identifying where the bulk of the memory usage is residing (e.g. Gen2 heap in the .NET memory), identifying the objects that make up the bulk of this heap, and then further tracing them down to specific reference pathways in your application.
To resolve the leak, you’ll need to find a way to reduce the number of these objects, or to sever the reference to them (or their parent objects) so that the .NET Garbage collector can clean them up.
LeanSentry Memory diagnostics do not include allocation profiling data
LeanSentry does not directly show you where in your code the objects causing your memory leak were allocated. Doing this requires maintaining a log file of all objects that have been allocated and the allocation stack trace, similar to the CLR Profiler tool, which is not possible given the “Just-In-Time” nature of LeanSentry memory diagnostics.
(In general, allocation tracking/memory profiling in production is a no-go due to the incredible performance overhead involved.)
Because of this, we use the reference trees (which objects currently reference the objects in question) to allow you to locate the offending objects in your code. This takes a bit more work, because you have to find where in your code these objects are created by using the types of the objects involved.
So how do you release the objects causing the high memory usage? Effective strategies include:
- Removing unnecessary data by setting it to null.
- Not storing objects in a long-term cache (or reducing cache duration).
- Reducing the number of objects stored.
- Reducing the size/number of large objects (particularly on the LOH heap).
- Using projection/more compact representations of data (e.g. storing a list of simple objects, instead of a DataTable).
For an example of fixing a sample memory leak in code, please see Resolve a memory leak using a LeanSentry memory diagnostic report.
Conclusion
IIS memory leaks in production have traditionally been hard to diagnose, which is why people often employ band-aid workarounds like recycling the application pool.
This often leads to a drastic increase in cloud/hosting costs, due to attempting to “fit” the leaky application that sometimes requires much more memory than it usually needs.
You can use LeanSentry Memory diagnostics to identify the source of w3wp memory leaks in production, and fix them to reduce the need for recycling + reduce your cloud costs.
In this guide, we reviewed a step by step process for enabling, finding, and diagnosing memory leaks in the IIS worker process. For more on this, please see our 3 part series here.
