What is a crash
A crash is an abnormal termination of the IIS worker process (w3wp.exe) due to an unhandled exception, stack overflow, or other critical failure. Crashes are a severe issue because they cause aborted requests, loss of state, and in some cases application downtime. Most APM tools do not detect crashes because the APM code inside the worker process terminates during the crash.
Because LeanSentry is external to your application, it can monitor and automatically diagnose production crashes in the IIS worker process (w3wp.exe) ... and any other process on your server.
Fixing a crash using LeanSentry Crash diagnostics
When a crash takes place in an important website, LeanSentry may notify you, directly including the code causing the crash in the email:
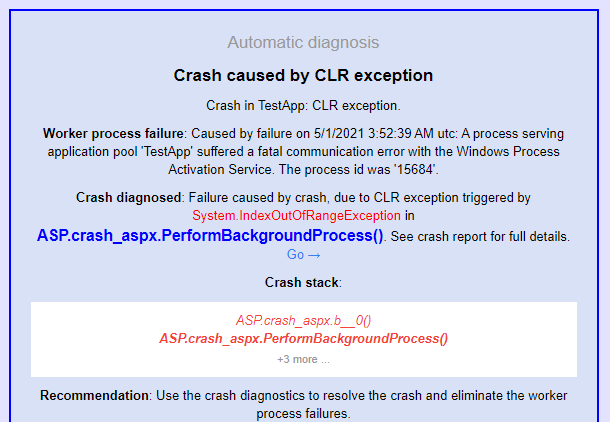
Click the link in the notification email to go to the Crash diagnostic report and see what caused the crash:
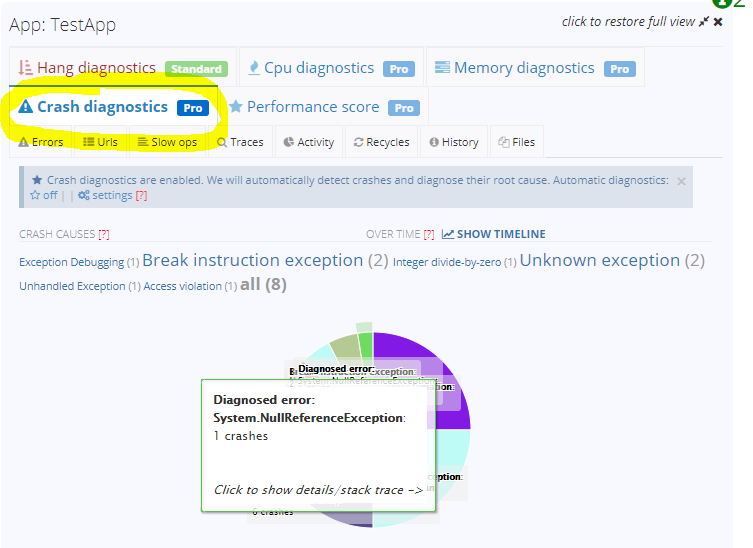
(Alternatively, you can select your website and go to it's "Crash diagnostics" tab to view all crashes LeanSentry detected for it.)
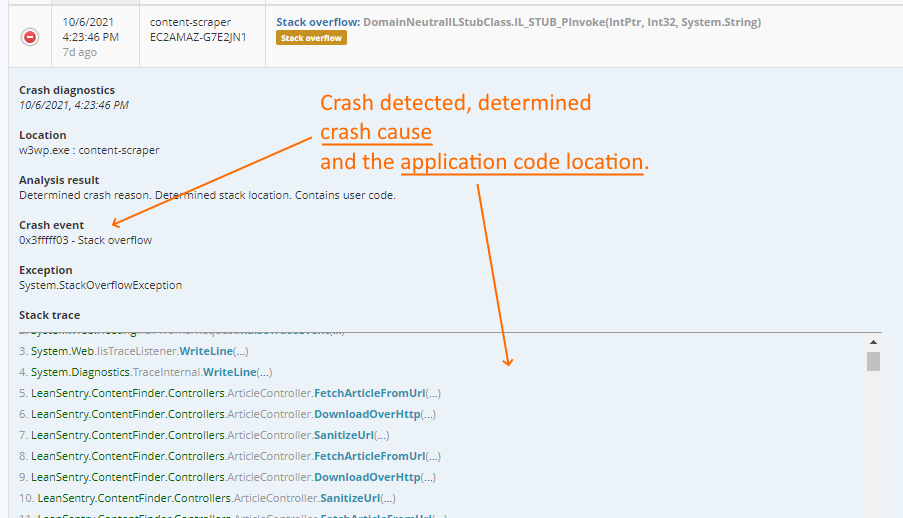
The crash report provides enough information to fix most crashes, by providing:
- The cause of the crash (stack overflow, unhandled exception, runtime error, etc)
- The application code causing crash (or system code where the crash took place)
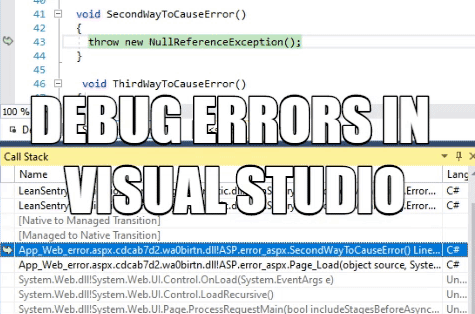
In some cases however, the crash stack trace may not provide enough information to a developer on WHY the crash took place. In that cause, a developer can use the crash dump associated with the LeanSentry Crash diagnostic report to reproduce the moment of the crash directly in Visual Studio. This way, the developer can inspect the state of application code in detail to figure out what led to the crash.
Debugging a production crash in Visual Studio
To debug production crashes in Visual Studio, follow these steps:
- Enable dump capture for Crash diagnostics.
- Mark a specific crash cause for dump capture.
- Locate a crash report and download the dump file.
Enable dump capture for Crash diagnostics
Open the Crash diagnostic settings and enable dump capture. You can select whether you'd like to save the dumps locally on the server, or to upload them to LeanSentry so your developers can download them.
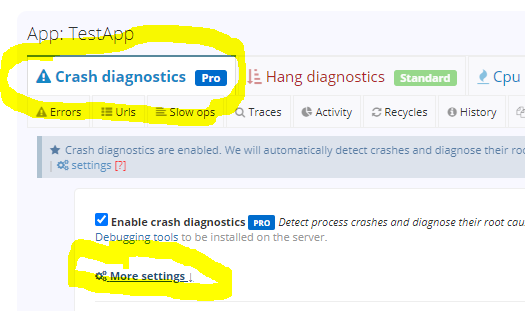
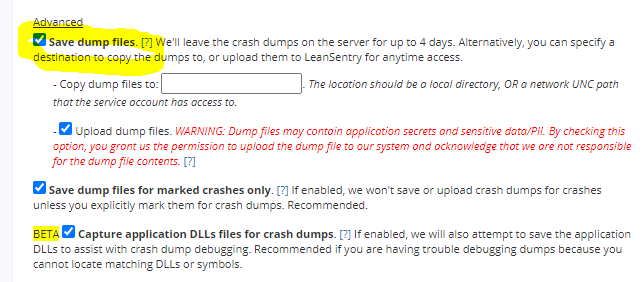
Note that by default, LeanSentry will only capture dump files for specific crashes you mark in the next step. This requires LeanSentry to observe a crash before your can enable dump capture. If you would like to capture dumps for all crashes, clear the "Save dump files for marked crashes only" checkbox.
Mark a specific crash cause for dump capture
Select one or more crash causes for which you'd like to capture dumps. You can also configure LeanSentry to capture dumps for ALL crashes by default, but be aware that this can increase the disk space and network overhead if you have a lot of crashes / if your process memory usage is large.
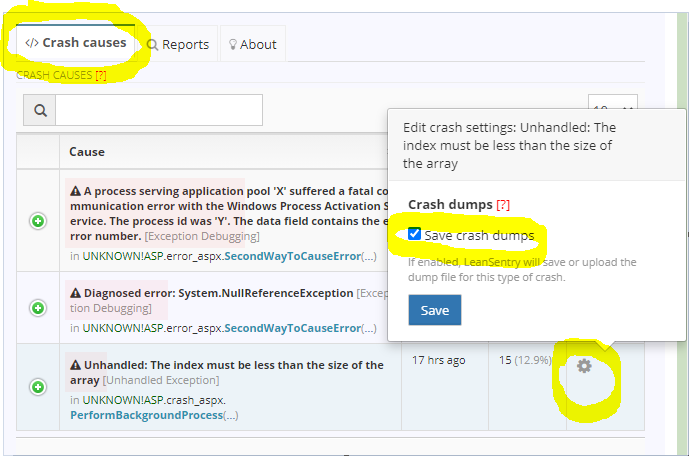
Locate a crash report and download the dump file
When a crash happens after you have configured dump capture for it, you'll be able to download the associated dump for local debugging.
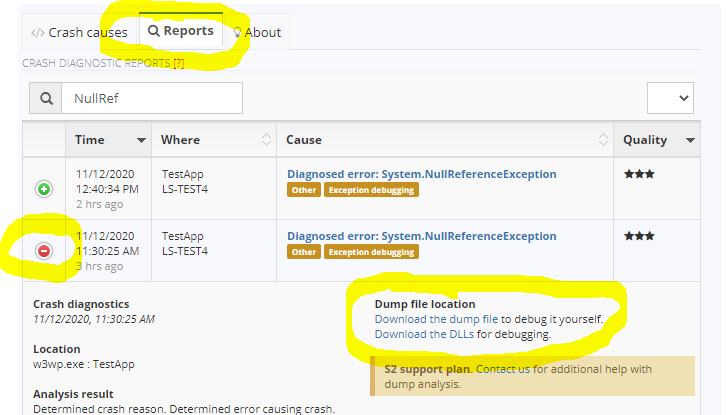
NEW Debug dumps without symbols, sources, or DLLs
LeanSentry now provides the ability to set up your local dev environment for debugging production dumps even if you do not have matching sources, symbols, and DLLs. To learn more, see Debug production dumps without symbols, sources, or DLLs.
