Hangs are the most common website performance problem for IIS and ASP.NET applications.
In this how-to, we’ll briefly review what causes hangs and go through a step-by-step process for analyzing and fixing hangs using the LeanSentry Hang diagnostics feature.
What is a hang
An IIS or ASP.NET hang takes place when requests to your IIS website begin to get “stuck” or take an unusually long time to finish. As a result, requests begin to queue up and your website appears to be down or unresponsive to your users.
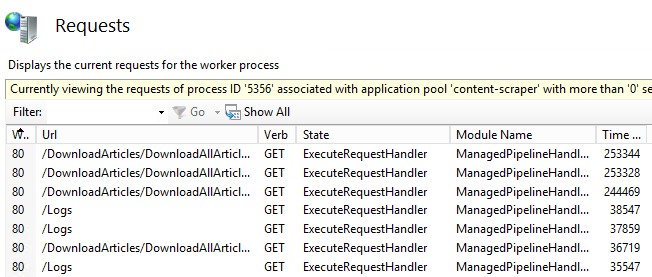
External signs that your website is experiencing a hang:
- Requests are queueing up (Using InetMgr Current Requests or Appcmd List Requests)
- IIS “Active Requests” performance counter is increasing quickly: W3SVC_W3WP\Active Requests.
- Your website is not responding/loading very slowly.
Hangs in production IIS websites can be very frustrating to troubleshoot, because they are usually not possible to reproduce outside of the production environment. As a result, they are not caught during testing, and are hard to catch/analyze in production without the typical development tools.
What causes hangs
Most hangs are caused by a combination of production load and a bottleneck or deadlock inside the application code that gets triggered by the load.
(This also explains why hangs usually only happen in production)
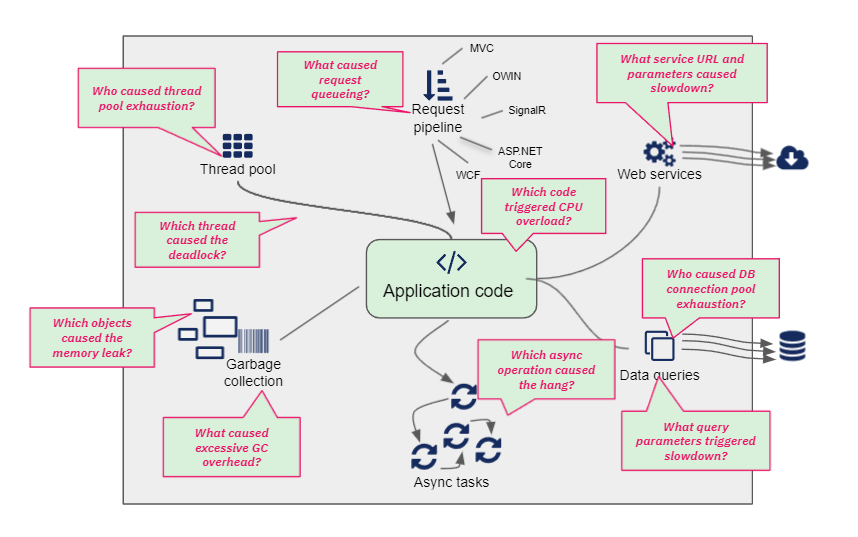
The factors involved in hang bottleneck analysis.
Often, the bottleneck requires the presence of resource exhaustion, including:
- Thread pool exhaustion. The CLR thread pool responsible for providing threads for request processing and task completions runs out of threads, often as a result of threads being blocked by application code but also potentially because of additional factors like high CPU usage and garbage collection.
- CPU overload. High CPU usage on the server or in the IIS worker process can prevent the CLR thread pool from growing, and cause some operations to take a longer time to complete. For more on fixing high CPU hangs, see our Fix high CPU usage in IIS worker process guide.
- Lock contention. Lock contention can cause a hang even without a full deadlock, by creating a wait cascade or exhausting the CLR thread pool. Lock contention can be made worse by and worsen high CPU usage.
- Garbage collection overhead. Excessive GC overhead can trigger hangs by impacting thread pool growth, and in general making application processing very slow due to thread suspension and the CPU overhead of garbage collection.
There are dozens of factors that can contribute to hangs in ASP.NET applications, but no single factor is sufficient to cause a hang on its own. Because of this, we don’t normally recommend focusing on any particular metric when diagnosing hangs.
The best way to diagnose a hang is to determine the specific code experiencing blockage at the moment of the hang, and put it in context of resource exhaustion present at that moment.
How to diagnose hangs
To fix a hang, we need to identify the hang when it is happening, analyze your IIS worker process to determine the code experiencing the bottleneck, and modify it to resolve the resource exhaustion causing the hang.
Identify website hangs
LeanSentry automatically monitors your website for hangs, and notifies you by email whenever it detects a severe hang:

LeanSentry does not notify you about every hang that it detects, to avoid overwhelming you during periods of poor performance. Instead, it notifies you occasionally about hangs that are severe, or when hangs get fully diagnosed.
To review all hangs LeanSentry has detected for your website, go to the “Hang diagnostics” tab for the website you are looking to troubleshoot:
(The website will usually show the “Hangs” tag to indicate that it has had hangs in the selected timeframe)

Then click the “Hang diagnostics” tab if needed:

When on the Hang diagnostics tab, you can visually view the hang reports generated by LeanSentry on the timeline graph.
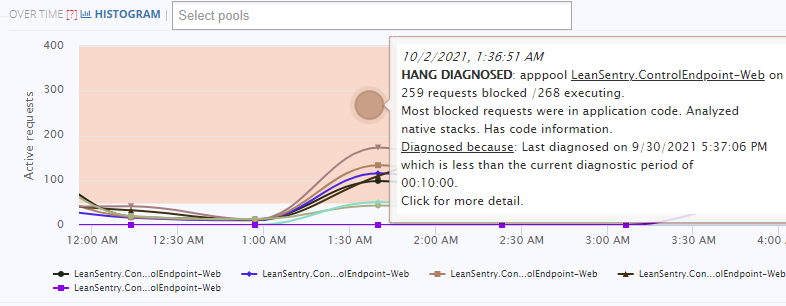
Important: To view the complete diagnostic details, be sure to open the reports shown by fully shaded bubbles.
This is necessary because LeanSentry does not fully analyze each hang (to keep diagnostic overhead on your server to a minimum). LeanSentry may show detected but not diagnosed hangs on the timeline as:
- Empty bubbles: the hang was detected but not diagnosed.
- Yellow bubbles: LeanSentry did not diagnose the hang to limit impact on your server, or because too many hangs have recently gotten diagnosed (diagnostic budget).
- Red bubbles: LeanSentry had trouble diagnosing the hang. You can see the error that prevented diagnosis when hovering over the report bubble, including missing diagnostic dependencies.
You can also view the list of hang reports in the table below:
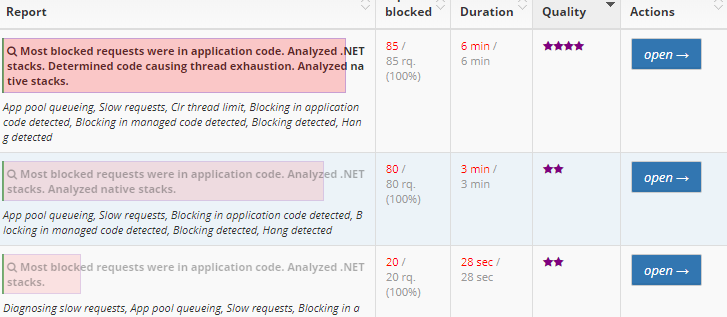
The reports with purple stars were diagnosed and contain code-level analysis details. LeanSentry will assign a star rating based on whether it thinks the results are conclusive (look for 4 star reports for best results).
Tips:
- You can also display a complete list of hangs by clicking “Show all hangs (including not diagnosed)”.
- Contact support for help if no hangs are being fully diagnosed.
Identify the code causing the hang
Open the diagnostic report to identify the application code that is responsible for the hang.
NOTE: Make sure the hang in the report was diagnosed. If the hang was detected but not diagnosed, it will NOT contain a code level analysis of the hang.
LeanSentry Hang diagnostic analysis will identify the issue causing the hang, and the code triggering it on the “summary” tab of the report:
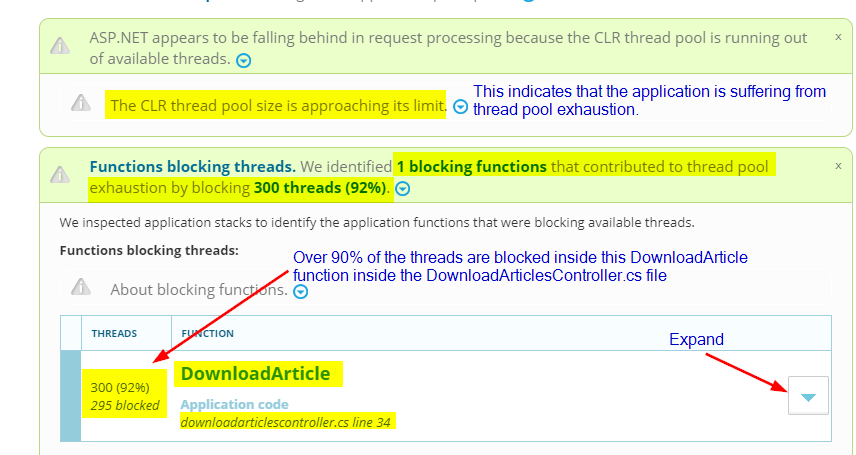
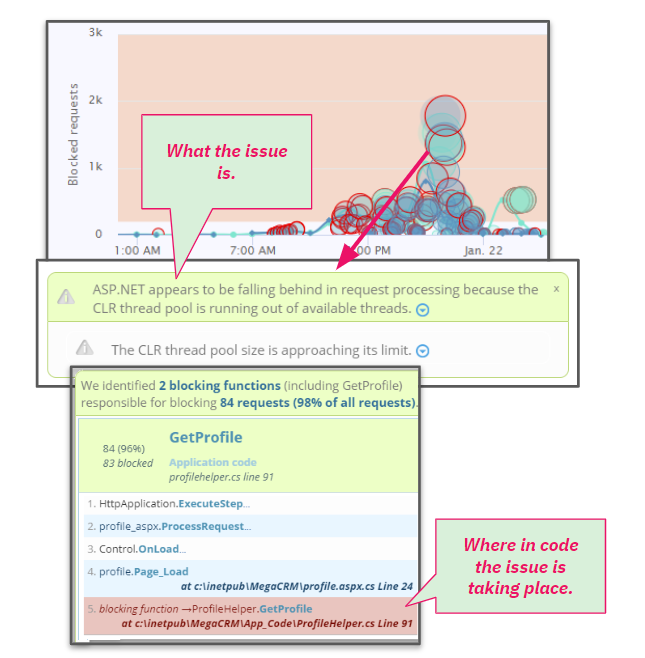
LeanSentry detects the cause of the hang to be ASP.NET thread pool exhaustion, caused by threads becoming blocked in the identified application code.
Expand the blocking function to view it’s complete blocking stack trace:

Once you identify the code that is causing the hang, you can modify it in a way appropriate to the type of resource exhaustion you are seeing. Let’s review that next.
Resolve resource exhaustion causing the hang
To resolve the hang, you’ll need to address the resource exhaustion issue the report identifies, that is being triggered by the identified application code.
The most common issues we see are:
| Hang cause | How to interpret |
| Thread pool exhaustion or starvation | The CLR thread pool is running out of threads for processing incoming requests, which will often cause new requests to be queued waiting for threads, and can also prevent existing requests from completing because of the lack of threads.
Use the “Functions blocking threads” information to identify the blockage points, and find ways to reduce blockage. |
| Request blockage | Requests are being blocked by application code. This is common when remote data services or database queries are taking a longer time to execute.
Use the “Functions blocking requests” information to identify the slow code points, and find ways to speed them up. |
| Async task blockage | Asynchronous tasks are taking a long time to execute, delaying request completion.
Because async tasks normally do not block threads, this issue is not about thread blockage. Instead, it’s simply about the async tasks taking a long time to complete. Use the “Tasks blocking requests” information to identify the slow tasks, and find ways to speed them up. |
For example, if the hang is being caused by thread pool exhaustion, you’ll need to reduce the blocking in the blocking functions identified to free up threads for request processing.
You can reduce the blockage by:
- Making the blocking operation asynchronous.
- Reducing the number of calls to the blocking operation (e.g. via caching).
- Speeding up the operation to reduce blockage (e.g. by optimizing the slow SQL query, reducing data volume, etc).
Note that increasing the number of threads in the CLR thread pool is NOT usually a sufficient strategy to resolve these types of hangs. You can increase the number of threads, but if your threads are becoming blocked quickly and for a significant time, your hang is likely to return or simply change over to the “request blockage” hang. Reducing/resolving the blockage is ALWAYS a better strategy than increasing numbers of threads.
Additional factors contributing to hangs
In some cases, hangs are caused or made worse by additional contributing factors, which can include:
- High CPU usage. High CPU usage can block thread pool growth, and slow down processing.
- Memory leaks/Garbage collection overhead. Garbage collection can slow down processing due to thread suspension, increased CPU usage, and inhibited thread pool growth.
LeanSentry will identify these contributing factors if they are present during a hang:

You can also view the associated metrics on the “Stats” tab of the hang diagnostic report:
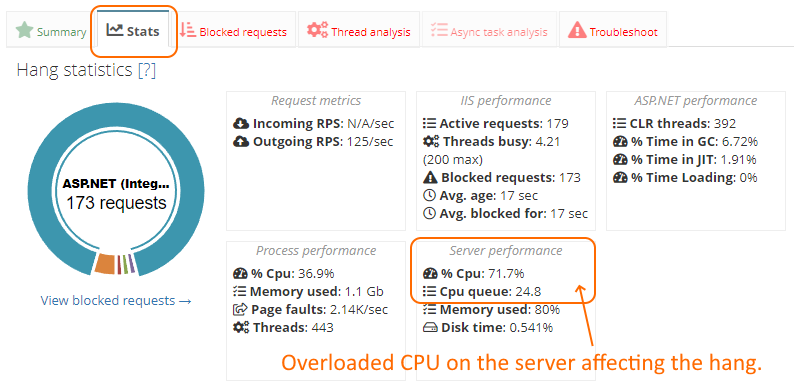
LeanSentry identifying CPU overload as a contributing factor to thread pool exhaustion (due to inhibited thread pool growth).
If these factors are present, you’ll additionally want to explore LeanSentry CPU diagnostics for diagnosing CPU overloads, and Memory diagnostics for diagnosing memory leaks/GC overhead that can be contributing to your hangs.
Conclusion
Most web applications experience hangs. Traditionally, getting to the root cause of hangs in production has been very difficult, because hang conditions are nearly impossible to reproduce in a test environment.
You can use LeanSentry Hang diagnostics are designed to simplify the process of diagnosing and fixing hangs in ASP.NET applications on IIS.
Follow this step by step guide to quickly identify and resolve hangs in your IIS websites whenever they arise.
To learn more about using Hang diagnostics, check out our 3 part Hang diagnostic walkthrough here.
