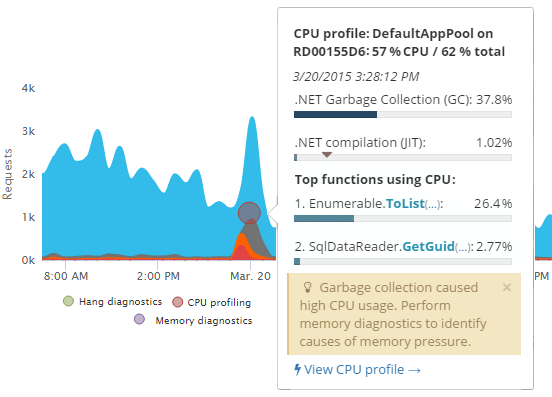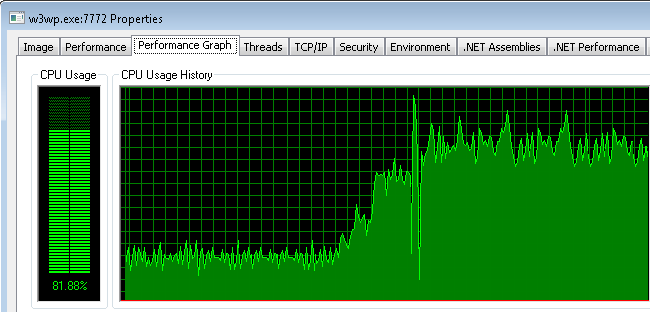
High CPU usage in the IIS worker process (w3wp.exe) is the second most-reported performance issue affecting IIS websites.
(Based on troubleshooting 30,000+ IIS websites with LeanSentry in the last decade.)
In an ideal world, web applications should be “elastic”, able to “stretch” to handle high CPU workload up to 100% CPU utilization, with only a small performance penalty. These optimized applications could maintain decent performance during peak load, and fully utilize their server resources (resulting in lower hosting/cloud costs).
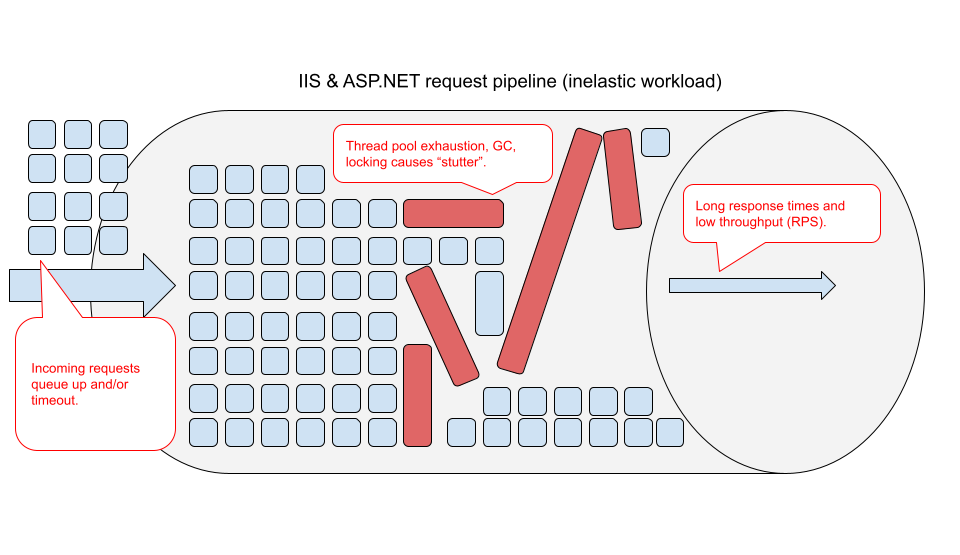
In reality though, most .NET web applications are NOT elastic. For these applications, higher CPU usage often leads to high CPU hangs, and excessive cloud/hosting costs necessary to maintain <50% CPU utilization at peak load.
In this guide, we’ll take a step-by-step look at how to use LeanSentry CPU diagnostics to identify and diagnose high CPU usage. Including identifying and optimizing the application code causing high CPU.
The costs of high CPU usage in in-elastic applications
High CPU hangs
Multiple factors including thread pool exhaustion, task contention, and garbage collection can cause the application workload to “stutter” and even completely freeze up at high CPU usage. For the explanation of why this happens, head over to Fix high CPU usage in the IIS worker process (Definitive guide).
Excessive cloud/hosting costs
If your workload is not elastic, you are also likely to try to keep your server CPU utilization low, e.g. not exceeding 50% at peak load. This ensures that your server hosting costs (aka cloud costs) are at least 2x what they need to be. In addition, because it’s nearly impossible to scale perfectly to peak traffic, you likely still have incidents where CPU utilization goes higher than desired and your website tanks.
How to diagnose CPU usage in the IIS worker process
Unfortunately, tuning the CPU usage of the application code is not easy to do during the testing phase. This usually leads to a lot of effort to optimize the wrong code. We explain the reasons for this in our comprehensive Fix high CPU in the IIS worker process guide.
Instead, the best approach we found is to detect instances of CPU-induced performance degradation in production, under the real workload. This way, you can optimize the code responsible for high CPU when it actually matters to your website performance.
This is the approach used by LeanSentry CPU diagnostics.
1. Identify high CPU usage issues
LeanSentry automatically detects instances of high CPU usage in the IIS worker processes serving your website. Some of those times, it performs lightweight profiling which determines the application code causing high CPU.
(LeanSentry does not diagnose each high CPU incident, to maintain a very low impact on your server.)
To view the high CPU incidents and inspect the diagnostic reports, select the website ...

and head to its “CPU Diagnostics” tab:

Once there, you’ll be able to see the high CPU incidents detected by LeanSentry on the timeline graph, as well as in the diagnostic report table below.

NOTE: LeanSentry does not diagnose every high CPU incident, to keep your diagnostic overhead low. Instead, it only diagnoses a small percentage of incidents that are considered important, and only if we don’t already have a recent fully diagnosed report.
Finding CPU diagnostic reports that contain full code information
To find a diagnostic report with full code information, be sure to look for filled-in bubbles on the timeline.
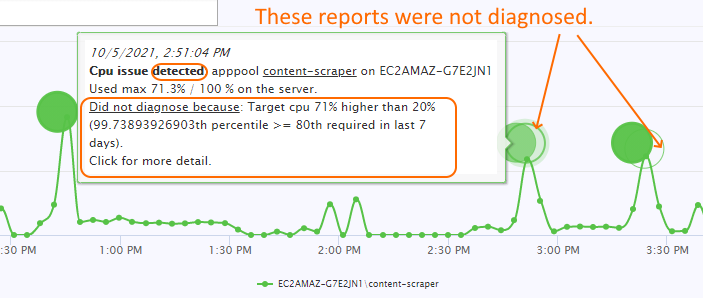
You may also see high CPU incidents that LeanSentry DID NOT diagnose, which can be shown as:
- Empty bubbles (outline only): LeanSentry did not consider this CPU incident important enough to diagnose.
- Yellow bubbles: LeanSentry could not diagnose because a diagnostic was already recently performed, or because we exceeded the allowable number of diagnostics for the day (diagnostic budget).
- Red bubbles: LeanSentry tried to diagnose but encountered an error.
If you do not have any fully diagnosed reports, LeanSentry may be having trouble diagnosing or your configured diagnostic intent or thresholds may be too high. Contact support for help.
Advanced: searching for specific CPU incidents
You can filter to CPU incidents in a number of ways:
- Select a server: by clicking the server in the left-hand server graph.
- Select a specific timeframe: by click-dragging on the % Processor Time timeline graph.
- Select a specific application pool: By using the “select pool” drop down select above the timeline graph.
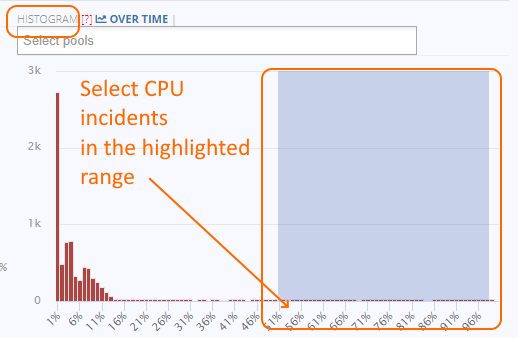
- Select a CPU usage range: by selecting a range of CPU usage on the histogram.
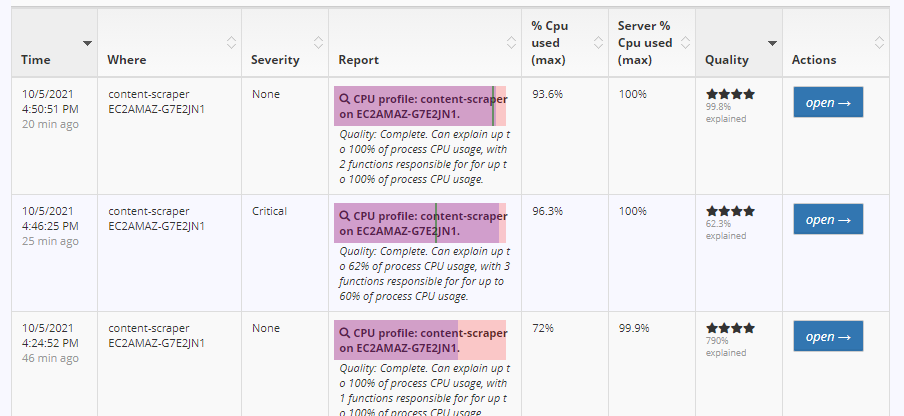
Additionally, you can sort reports by application pool CPU usage, server CPU usage, and diagnostic quality in the report table:
2. Determine the application code causing high CPU usage
Once you have identified a fully-diagnosed report, you can view it to inspect the code causing the CPU usage during the described incident.
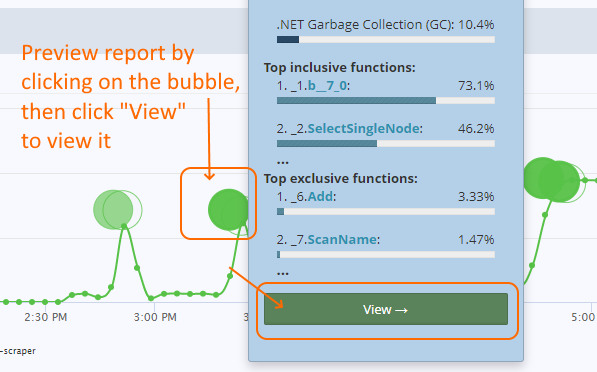
Previewing the CPU diagnostic report.
Inside the CPU diagnostic report, LeanSentry will identify pathways in your application code that contributed the most CPU usage during the CPU incident:
NOTE: If your report does not contain code information, please be sure you are viewing a fully diagnosed report.
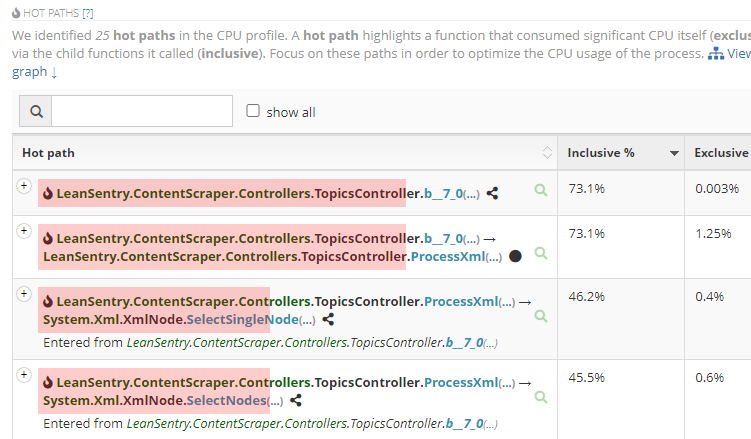
Each hot path represents a pathway in the code that consumed the most CPU cycles. You can expand each hot path to view the separate stack traces that we are including in the path.
The CPU contribution of each way is shown in two ways:
- Inclusive: the total CPU contribution of the pathway, including all child functions it contains.
- Exclusive: if the pathway represents a specific function whose code consumed the CPU usage, it will be shown as exclusive usage.
We recommend focusing on the paths that contributed the most inclusive usage, and then tracing through them to find the earliest opportunity for optimization (more on this below):

Another way to identify the hot paths in the application is to use the visual flamegraph to drill into the major CPU pathways:
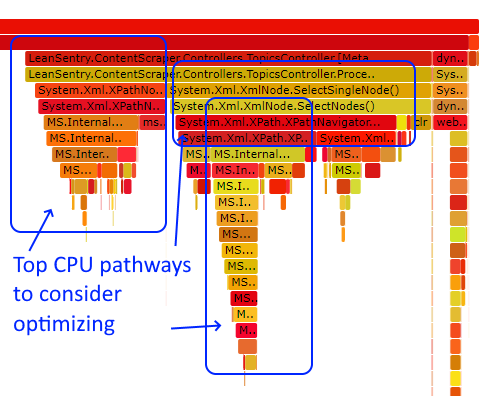
The width of the frames shown in the flamegraph represent the % of the CPU cycles in the report that were consumed due to the function shown in the frame.
Therefore, the wider the pathway, the more opportunity to reduce CPU usage by optimizing it.
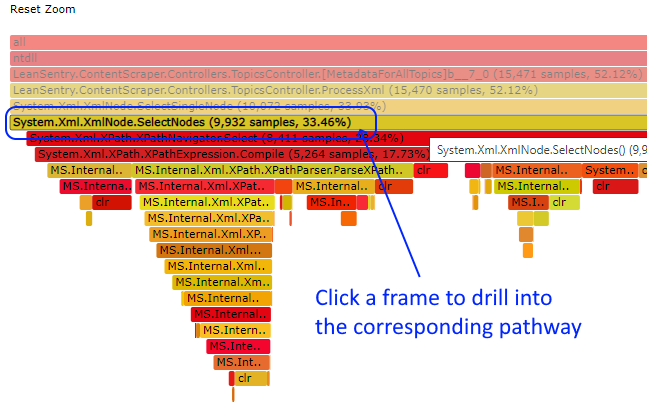
You can click any frame in the flamegraph to drill into the corresponding pathway, in order to see it in more detail:
3. Optimize the code based on the CPU diagnostic report
Once you identify the main application code pathways contributing CPU usage, you can begin working on optimization.
For more general discussion on CPU optimization, see optimizing the code in our Fix high CPU usage in the IIS worker process guide.
While the actual code changes will depend entirely on your code and which pathways are actually causing high CPU usage, here are some strategies we normally recommend to LeanSentry customers:
Optimize the right code
Make sure to only consider optimizing pathways that contribute a significant portion of your CPU usage, as per the CPU diagnostic report.
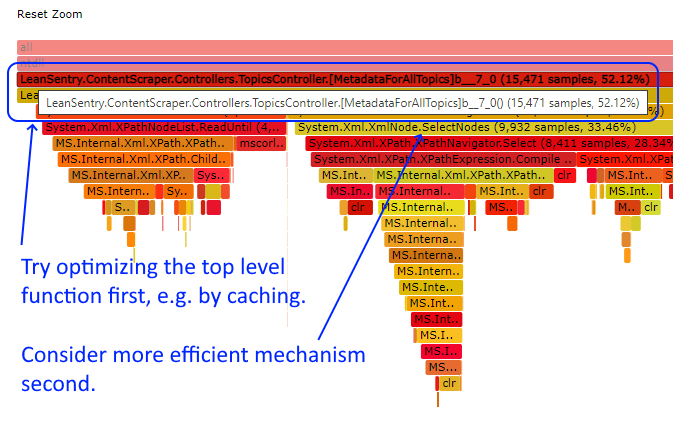
Try top-down optimization first
In most applications, the biggest CPU usage will be inclusive, due to one or several top-level functions. However, it will also be the product of dozens or hundreds of function calls further down the stack.
Before looking into optimizing any of the low level or “leaf” functions, look into opportunities to optimize at the top level. For example:
- Caching the output of a top level function, to reduce calls to it.
- Reduce requests or calls to the top level function.
- Switch to a different implementation of the top level function, for example choosing protobuf-net serialization over JSON.
Recognize bottom-up optimization opportunities
In some cases, the CPU usage will be due to exclusive CPU usage from a specific low-level/leaf function. This function may be called from dozens of different pathways in your application.
This may be harder to spot using the top-down pathway approach shown in the flamegraph, so be sure to zoom into some of the biggest pathways to see which functions end up being called.
If you do have a specific function that’s exclusively contributing a large portion of the CPU usage, you can remove/reimplement this function to reduce CPU usage across the board.
Examples of such places often are:
- Inefficient logging libraries.
- Dependency injection libraries (e.g. Ninject).
- Excessive tracing or logging.
Conclusion
High CPU usage in your IIS worker process can cause poor performance, and keep your cloud costs 2x+ higher than necessary.
High CPU usage issues in production can be difficult to stay on top of, even if you do regular performance testing.
You can deploy LeanSentry and leverage LeanSentry CPU diagnostics to automatically identify the application code causing CPU issues in production.
Once you’ve resolved you high CPU issues, be sure to stay on top of any new CPU usage regressions to keep your optimal performance going forward!
