Performance is complicated
Despite advances in Application Performance Monitoring (APM) tools in the last decade, many teams still struggle with everyday performance issues without a consistent capability to definitively resolve them.
In a way, the APM industry has not delivered on its promise to provide actionable insight, needed by application teams to actually maintain and improve application performance.
In our opinion, the reason is simple.
Performance is complicated. It's not enough to know that your application has an issue. To take action, the team must have the insight to understand WHAT the underlying cause is, WHY it takes place in the application-specific code, and HOW to resolve it in a best-practice manner.
Without the expertise to interpret the performance data, and the effort required to make sense of it, technical teams often have trouble achieving the results they need.
Making performance actionable
To take meaningful action, teams require the understanding of the complex interaction of application code, platform runtime, and production load that gives rise to most performance problems.
This is not easy, but it is possible.
At LeanSentry, we have made it our mission to use our technology + our expertise to help our clients go from awareness of performance problems, to an understanding of their causes, and all the way to an actionable resolution.
To accomplish this, we use a combination of LeanSentry production diagnostics, and our systematic performance issue resolution process.
The top IIS and ASP.NET performance questions our clients ask
Without further ado, here are the top questions asked by LeanSentry clients about their application performance.
For each question, we share our big-picture answer, and the specific strategy for using LeanSentry diagnostics to determine the application-specific answers you need to actually resolve the issue.
Is my problem due to the server or the application code?
This is the most common question we get when we first begin working with a customer. It comes from a deeper disconnect between the people managing the production application experiencing problems, and the application developers who do not typically experience those same problems in their test environments.
Therefore, as the conversation often goes "it must be the server".
This doubt often continues even when diagnostics identify the underlying issue and the source code location. This uncertainty makes sense, because if the application works in testing and is OK most of the time, there must be something ELSE that is causing the problem?
The general answer
In our experience, production performance problems are most often caused by a COMBINATION of two things:
- An application bottleneck. This is specific code in the application that, under the right conditions, creates a slowdown, or exhausts a runtime resource.
- Production load. A degree of load, server resource utilization, or internal application activity that causes the bottleneck to become a problem.
This is why most performance issues ONLY happen in production. This is also why the most effective solution usually lies in the application itself, rather than adding hardware or looking for causes in the server or network configuration.
Our method
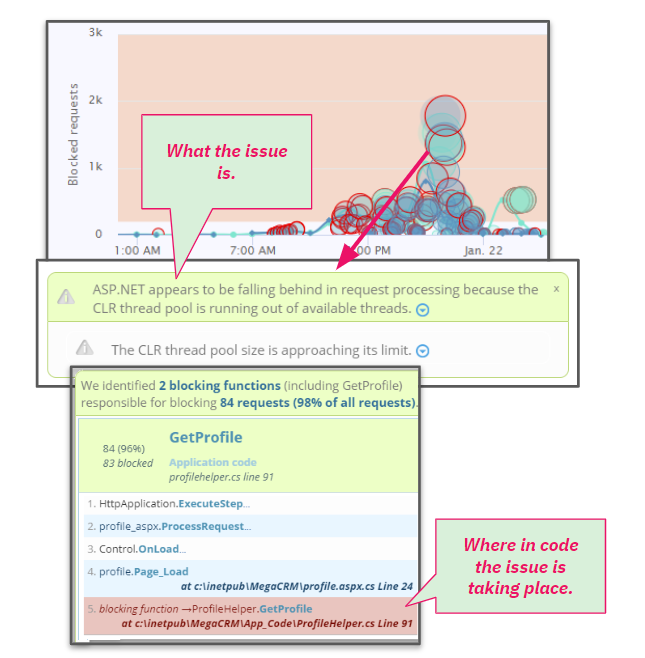
Our approach is simple. LeanSentry diagnostics identify the issue, and capture the evidence we need to identify (a) the underlying issue and b) the location of the bottleneck in the application code.
Armed with the understanding of the "dynamics" of the issue, the effective solution often becomes fairly obvious.
For example: A website stops processing requests/hangs under load because a single slow transaction took a lock, and other transactions waiting on that lock blocked enough threads to cause thread pool exhaustion. That in turn caused incoming requests to become queued waiting for threads. The thread pool exhaustion is the issue, and while the single slow transaction is the root cause, the effective solution is to move the slow transaction out of the global lock to eliminate thread pool exhaustion and unblock the application.
If needed, we can then help your team to correctly interpret the diagnostic, and perform comprehensive application analysis to determine exactly WHY the issue arises in your code. For more, see support plans.
Why is my IIS website slow even when the server is not under load/has low CPU usage?
This question usually comes from the expectation that performance issues happen ONLY when the server is busy, particularly as indicated by CPU usage or in some cases concurrent connections.
In a way, this question is about whether the server itself, or at least server utilization, is the cause of the problem.
The general answer
In our experience, many, if not most, of the application hangs occur while the server has practically zero CPU utilization!
(See our guide for optimizing high cpu usage in the IIS worker process if you ARE indeed having high CPU hangs.)
The underlying reasons for these hangs are usually that either the application has encountered a deadlock, causing all activity to stop, OR application blockage caused some resource in the application to become depleted. That resource is usually, but not always, the CLR thread pool responsible for providing the threads for request processing.
The "low CPU" hangs are very often associated with a pileup of requests that appear "queued", and do not clear up until the application pool is restarted or taken out of the load balancer.
In yet other cases, there is no dead lock or thread pool exhaustion, but simply an application delay in data retrieval or external service calls.
Our approach
Not surprisingly, the best way to resolve such hangs is to use LeanSentry diagnostics. The LeanSentry Hang diagnostics automatically identify hangs and determine both the mechanism of the hang (e.g. thread pool exhaustion) AND the location of the bottleneck in the application code.
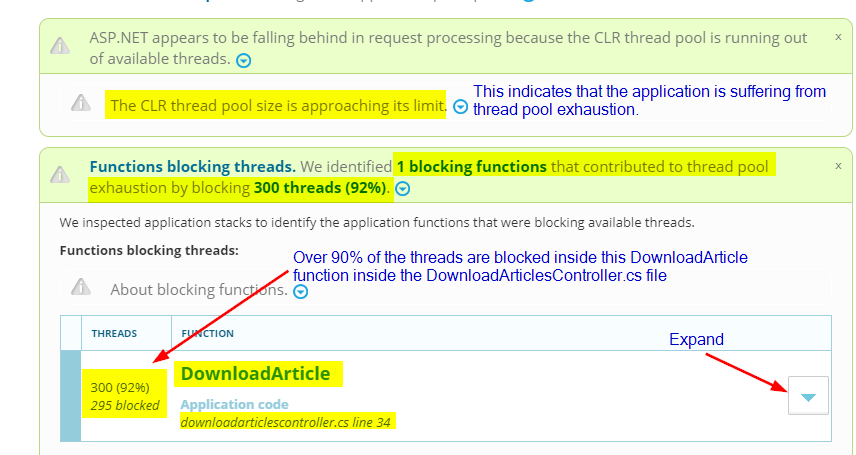
Interestingly, it is very difficult to "guess" what might be causing the hang, because it can be a single line of your application code that just happened to create a bottleneck under some specific production traffic pattern. This is why many of our clients have been dealing with hangs for months prior to resolving them with LeanSentry.
Thankfully, by using the hang diagnostics to identify the actual location of the bottleneck, you no longer need to guess.
Why are my IIS requests queued?
IIS and ASP.NET may queue requests at 4 or more points during request processing. This can happen due to thread pool exhaustion, CPU overload, or an excessively asynchronous application workload. To answer the question of WHY the requests become queued, we must first determine which queue the request is in and then identify one or more factors that led to the queueing.
So, why are my requests queued in IIS, or why are my requests stuck in ExecuteRequestHandler or ManagedPipelineHandler?
The general answer
Here is a surprising fact. If you are seeing requests blocking in "ExecuteRequestHandler", there is a very good chance your website is not experiencing ANY queueing at all.
Instead, what you perceive as "queued" requests, are actually slow or blocked requests in your application. These requests will often show up as sitting in your request pipeline inside the IIS Manager/inetmgr.exe management tool.
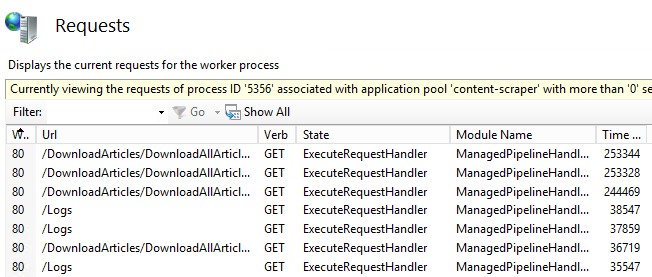
The requests sitting in ExecuteRequestHandler inside the ManagedPipelineHandler module are usually requests blocked in your application code, or in some cases hung due to an application deadlock or a hang.
Now, in SOME cases these requests ARE queued. This can happen as a result of a thread pool exhaustion hang, or an overly asynchronous high-CPU hang.
Or, requests may be queued in the IIS application pool queue, which is a common problem when your server becomes overloaded due to CPU overload or excessive parallelism. This a separate queue, and a separate problem.
Our approach
Measure, then cut. LeanSentry Hang diagnostics will diagnose each hang, and provide the evidence we need to determine where the requests are queued/blocked, WHY the queueing is taking place, and the corresponding bottleneck in your application code that is triggering it.
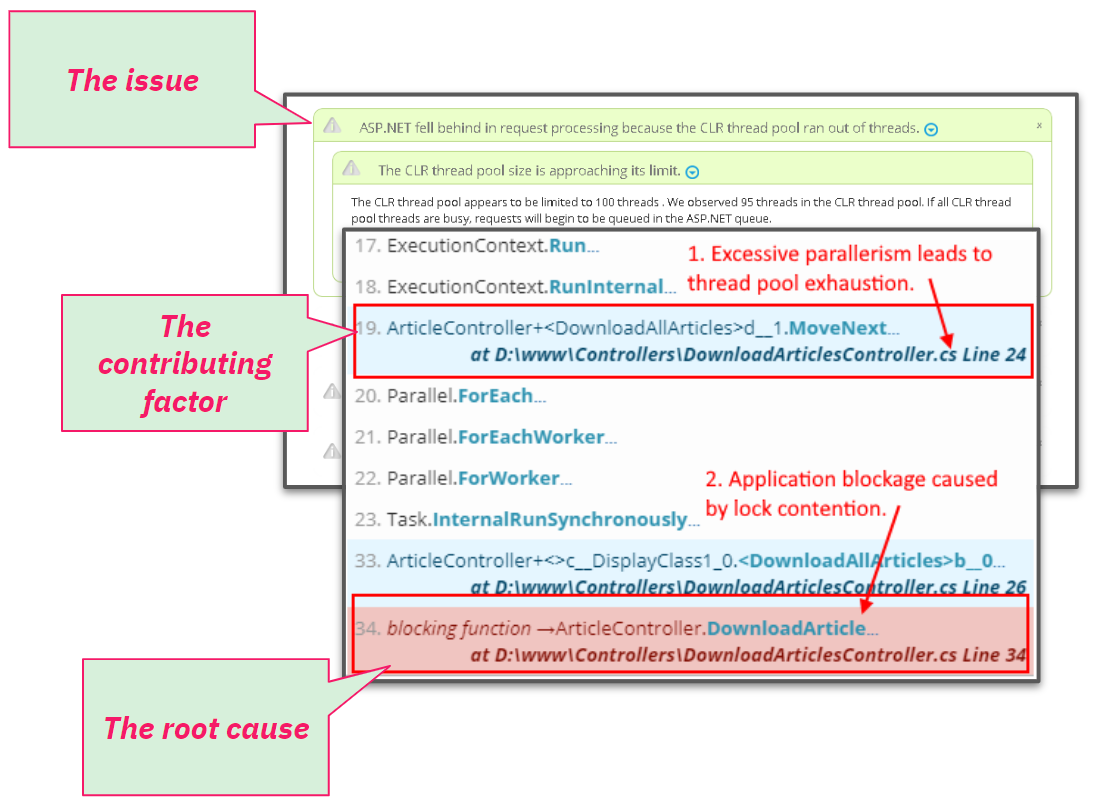
If the requests are queued due to thread pool exhaustion, the hang diagnostics will identify the application blockage or deadlock causing it.
If the requests are queued due to CPU overload, the hang diagnostics will identify the underlying cause (e.g. thread pool cannot keep up with volume of async completions) and the async tasks or application functions causing CPU overload.
Ok, I now understand that I have a hang, deadlock, thread pool exhaustion, memory leak, or crash. I now know where in the code it happens. But WHY does it happen?
And here we come to the inevitable question that arises when the application developer receives the results of the production performance investigation. After all, the code works just fine most of the time/all the time in the test environment.
And this is also where many of these investigations fail to produce an actionable result, because, even with the precise code location of the issue, it can be very difficult to determine exactly WHY the issue actually takes place.
To get to the resolution, we must answer the WHY question.
The general answer
There is no general answer!
Or, to be more precise, the general answer is not good enough. What we need is a specific answer, specific to the application code, and the unique inputs that gave rise to the problematic condition in the code.
Our approach
In over 70% of cases, the developers can determine the conditions leading to the issue from the diagnostic data on the issue itself and the source code location. Then, they are able to make the correct fix and all is well.
In another ~20% of cases, we can help interpret the diagnostic results to help your developers understand the issue and how it relates to your application code. You can request this help anytime as part of your support plan.
In less than 10% of cases, a developer may need to dive deeper into the specific state of the application at the moment of the issue, to determine why the issue takes place. This requires the memory state of the application captured at the exact moment of the issue, the diagnostics outlining the issue itself, and some debugging magic.
(You now can use LeanSentry to capture the dump of issues including hangs, memory leaks, errors, and CPU overloads, so that your developers can debug through the problem themselves. For more, see Debug production hangs in Visual Studio.)
Getting help with advanced debugging
Debugging complex issues can be a complex process, and is both the science and the art of performance analysis. As part of LeanSentry Priority Issue Resolution service, we routinely perform this analysis to aid in the resolution of more complex performance issues.
NOTE: Dump analysis services are not included in the standard support plans. Most issues are resolved without the need for dump analysis. We may be able to offer these services separately when necessary for issue resolution.
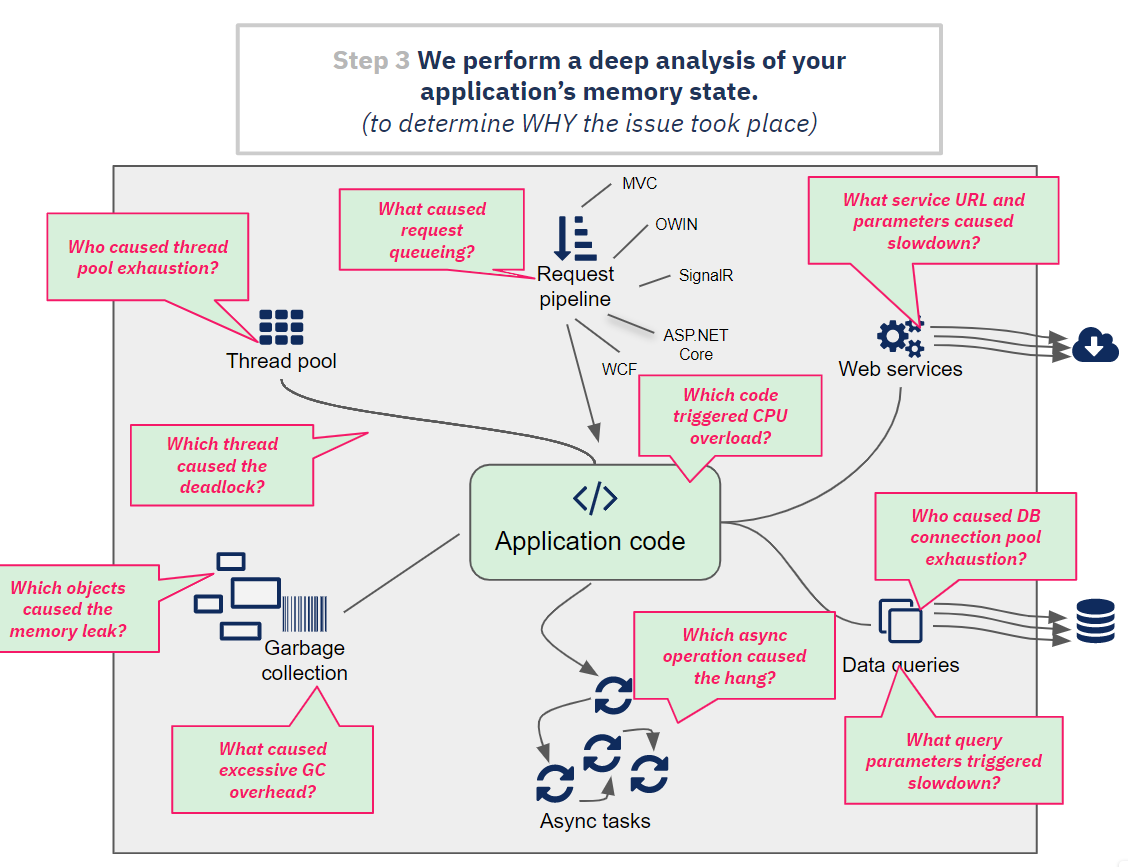
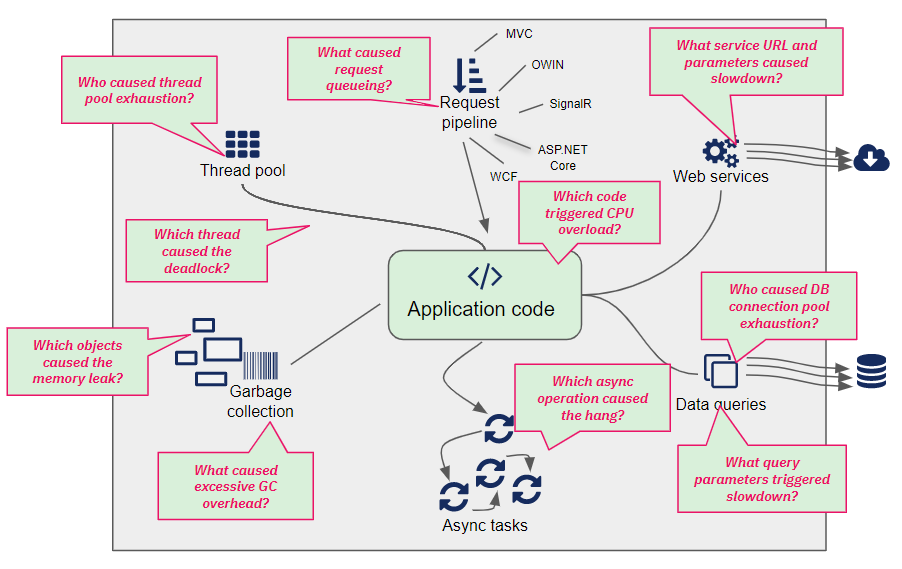
With application analysis, we are able to discover the relevant details necessary to determine WHY the issue took place, including but not limited to:
- The asynchronous operations/tasks causing the hang.
- The exact method parameters, request inputs, or SQL query parameters that caused the slowdown.
- The source of specific objects causing memory leaks and elevated Garbage collection.
- The state causing complex application deadlocks.
- The code causing SQL connection pool exhaustion.
- The complex reasons for queueing and performance degradation.
Extracting this state in a way guided by the diagnostics and the application's code can help application developers to produce a definitive fix for more complex issues.
The WHAT, WHERE, WHY, and HOW
This, in our experience, is what it takes to successfully convert performance monitoring insights into actionable improvements to your application's stability and performance.
The what: the underlying issue causing the problem. This is automatically determined by LeanSentry diagnostics.
The where: the code location of the bottleneck causing the issue, as determined by LeanSentry diagnostics.
The why: the critical insight into WHY the condition arises given the diagnostic information, expert interpretation, and in some cases deeper application analysis.
The how: the fix that is able to resolve the issue by addressing the application bottleneck in a way that effectively eliminates the problem.
