How it works
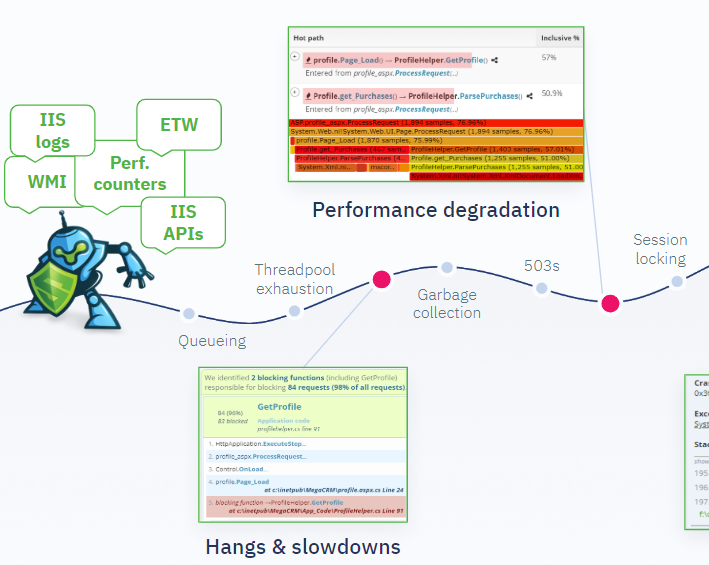
LeanSentry monitors your applications using lightweight data from standard Windows monitoring protocols including IIS logs, ETW traces, Performance counters, and others.

It then correlates this data in real-time to identify most performance issues that affect your applications, including:
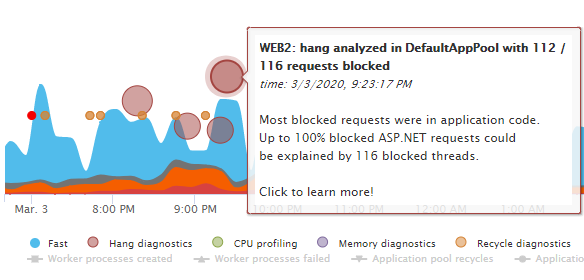
- Hangs and slowdowns.
- High CPU usage.
- Memory leaks.
- Crashes and errors.
- Performance degradation due to queueing, Garbage collection, and more.
Diagnose issues
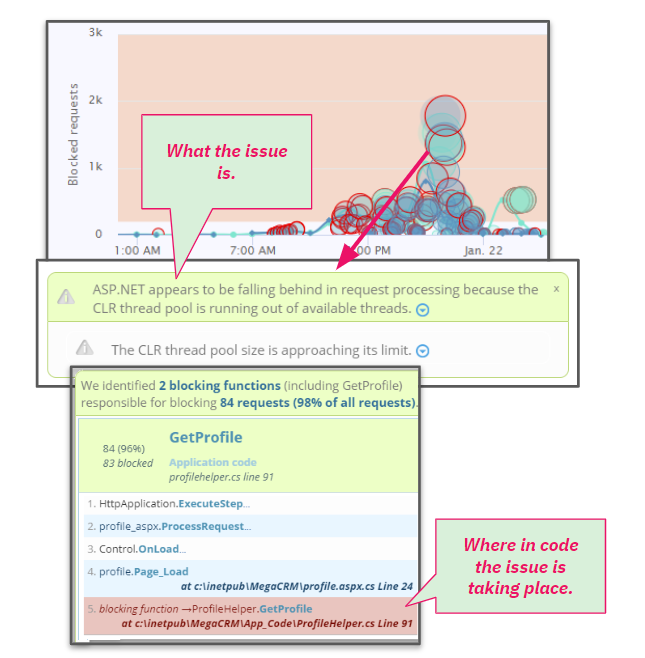
When LeanSentry detects an issue, it automatically captures the necessary information to diagnose it.

Your team can use the diagnostic reports after the fact to identify what the cause was, and what code in your application was involved in triggering it.

Get started
To begin detecting issues in your applications, install LeanSentry on the server(s) where you are experiencing issues.
LeanSentry will then begin to discover issues over the course of the first several days.
Once LeanSentry has observed each issue and captured diagnostics, your team will be able to view the diagnostic reports to begin resolving the issue*.
* Full diagnostics are available on the LeanSentry Professional plan or above. Contact us to get a preview of your diagnostics.
Not ready to deploy?
If you do not have access to your production servers, or have security or data privacy restrictions, we offer a number of options to get you started.
Contact us for a brief consultation and we'll be happy to identify an option that works for you.
