When LeanSentry diagnoses a production issue like a crash, hang, or an error, it provides code-level information to help a developer identify the issue without having to reproduce it locally.
However, the developer may at times desire additional details about the state of the application, user inputs, and others that are not available in the diagnostic report. To aid with the debugging process, LeanSentry provides a mechanism to capture the application dump at the moment of the issue so the developer can debug it locally in their development environment (e.g. Visual Studio).
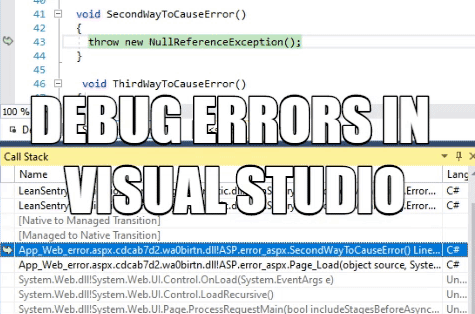
To successfully debug a production dump in Visual Studio, the developer needs to have symbols and sources for the application begin debugged.
However, it's common that the exact sources and symbols matching the production application are not locally available.
If this is your situation, use the process below to set up your local dev environment for production debugging.
Setting up debugging without symbols
We are going to use a free symbol server called dotPeek to provide symbols for debugging the dump.
dotPeek requires application DLLs in order to decompile them into symbols and sources. If you have access to the exact version of the application DLLs, you can use those. However, in most cases if you do not have the symbols or sources, you also don't have the exact DLLs. If so, read on to have LeanSentry extract the DLLs from your production application when it captures the dump.
Use LeanSentry to obtain application DLLs
LeanSentry now provides an option to extract the application DLLs when it captures the dump of your issue. To enable DLL capture, configure it whereever you enable dump capture.
For example, if enabling dump capture for Crash diagnostics, you can request DLLs to be captured as well:

Set up the dotPeek symbol server in your development environment
To set up the dotPeek symbol server, follow these steps on your development machine:
- Download and install dotPeek.
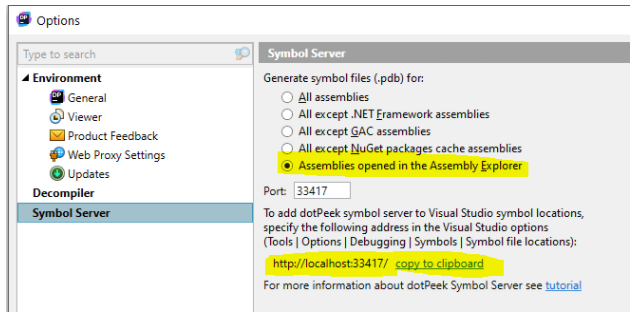
- Configure the dotPeek symbol server options (Tools > Options > Symbol server) to generate PDB symbol files for "Assemblies opened in the Assembly Explorer".
![Configure the dotPeek symbol server.]()
- Start the dotPeek symbol server.
![Start the dotPeek symbol server]()
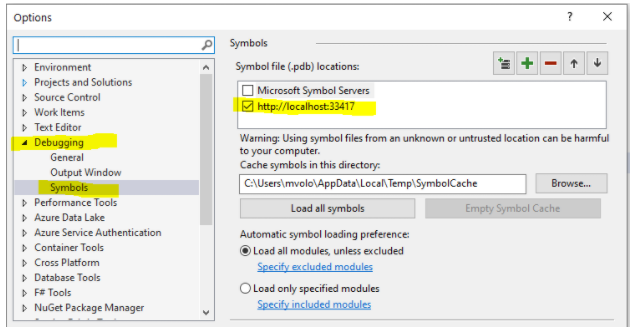
- Lastly, configure the dotPeek symbol server in Visual Studio (Debug > Options > Debugging > Symbols).
![Configure the dotPeek symbol server in Visual Studio.]()
At this point, you have generally set up the dotPeek symbol server to provide symbols for debugging on your development machine. Read on to acquire the dump files and DLLs and initiate your debugging session.
Download and debug the dump file
To start debugging:
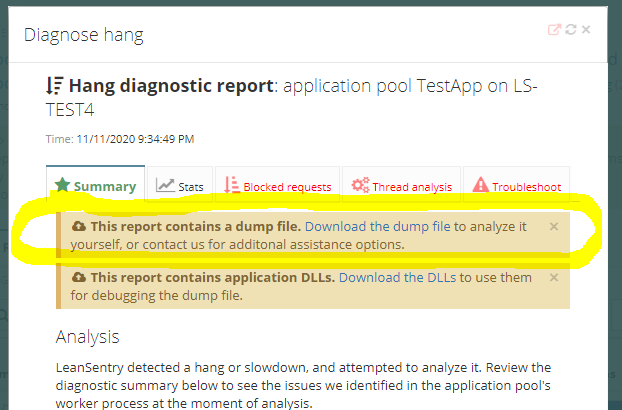
- First, locate the LeanSentry diagnostic report containing your dump file.
For example, you can get dumps for crashes, errors, or hangs.
![Downloading the dump file and application DLLs from a hang diagnostic report.]()
- Download the dump file AND if desired, the application DLLs captured by LeanSentry.
Keep in mind that you must have configured the dump capture (and DLL capture if you need the DLLs) previously for the dump (and DLLs) to be available.
Unzip the dump file, and the application DLLs as needed.
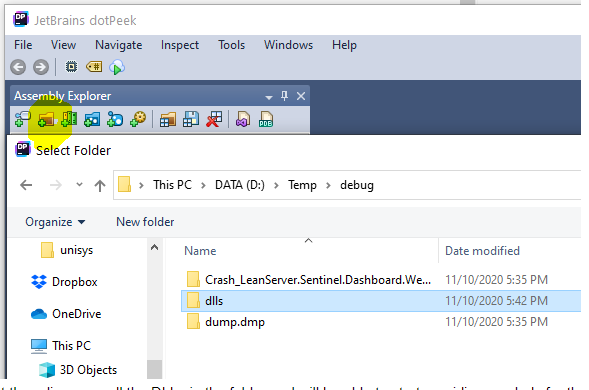
- Add the DLLs directory to dotPeek (Assembly Explorer > Browse).
If you are providing your own DLLs, browse to them here, or use the DLLs downloaded from LeanSentry.
![Browse to the application DLLs in dotPeek]()
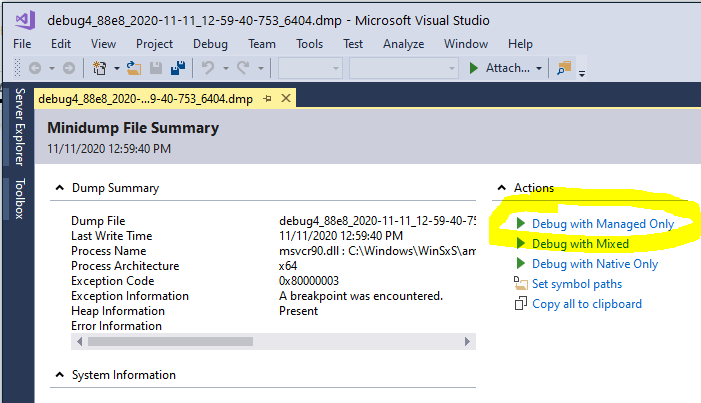
- Open the dump (Control-O) and initiate debugging by clicking "Debug with Managed code only"
![Open the dump to begin debugging]()
Note that you can also configure Visual Studio not to load all symbols right away, and instead right click on a specific dll in the Modules tool window or right click on a specific function in the stack trace to load the symbols.
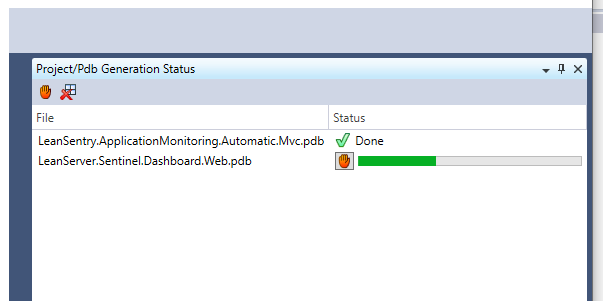
Each time symbols are needed, you can see dotPeek generating the symbols in the dotPeek "Project/Pdb Generation Status" window:
![Check the PDB generation status in dotPeek]()
Wrapping up
Use LeanSentry's dump capture and DLL extraction features alongside with dotPeek's symbol server to set up full-fidelity debugging for production issues inside of your development environment.

To see how to enable dump capture for various production issues LeanSentry diagnoses, check out:
