To debug production errors in Visual Studio, follow these steps:
- Set up prerequisites for production error debugging.
- Enable dump capture for Crash diagnostics.
- Mark a specific ASP.NET error for dump capture.
- Locate an error dump and download the dump file.
Prerequisites
To enable LeanSentry production error debugging feature, you must have the following prerequisites met:
- Windows Debugging tools present on the server. For more, see Installing Windows debugging tools.
- Deploy the latest ApplicationMonitoring.dll libraries to your application. For more, see Enhance LeanSentry application diagnostics with LeanSentry.ApplicationMonitoring.dll.
Enable dump capture for Crash diagnostics
Open the Crash diagnostic settings and enable dump capture. You can select whether you'd like to save the dumps locally on the server, or to upload them to LeanSentry so your developers can download them.
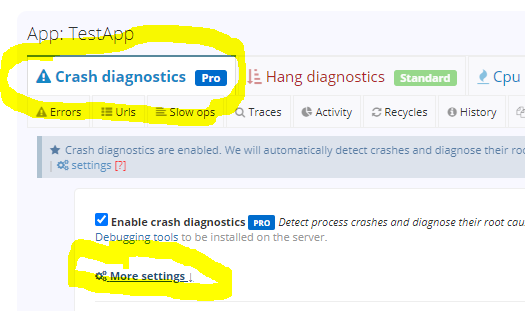
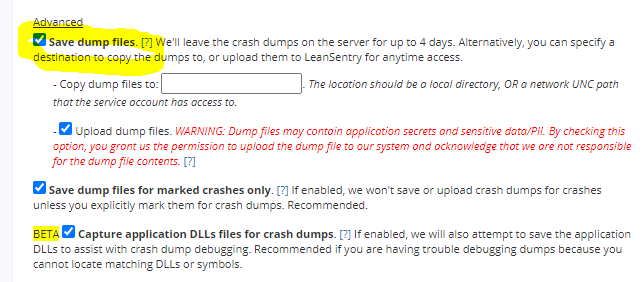
Note that by default, LeanSentry will only capture dump files for specific crashes or errors you mark for dump capture. So, if you are having crashes you do not need to worry about their dumps being saved unless you explicitly request it for each crash cause, or clear the "Save dump files for marked crashes only" checkbox.
Mark a specific ASP.NET error for dump capture
Select a website, and go to the Errors tab, and enable dump capture for one or more errors for which you'd like to capture dumps.
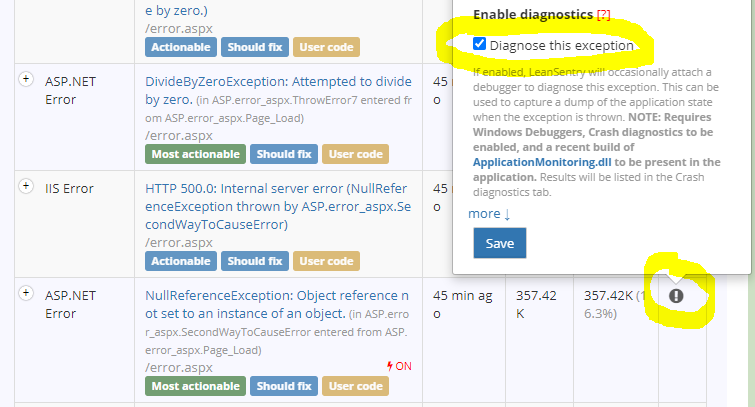
Note that LeanSentry will only capture dump files for each error one time per day, to minimize impact to your application. Please see Debugging application exceptions with LeanSentry Error Diagnostics for details on configuring ASP.NET error debugging and any associated considerations.
Locate an error diagnostic report and download the dump file
After configuring error diagnostics, the LeanSentry.ApplicationMonitoring.dll library in your application will intercept the errors you enabled for diagnostics and generate a dump for them. This process will happen at most 1 time/day/error on each server where error diagnostics are enabled, with a mandatory delay in between attempts to reduce impact on your server.
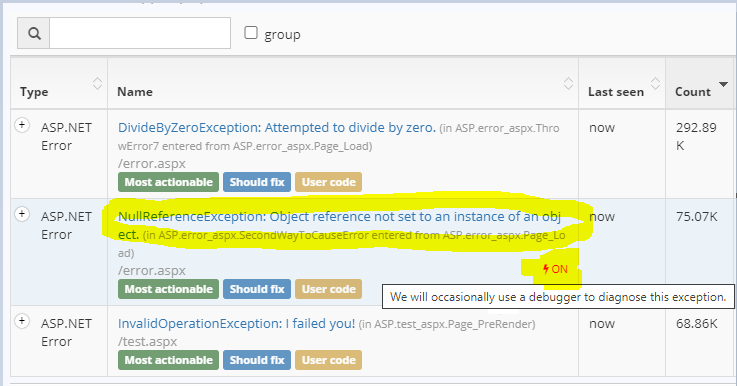
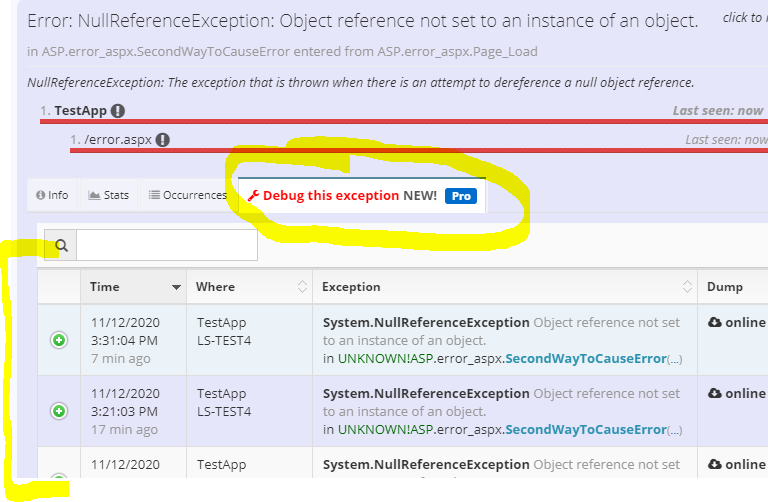
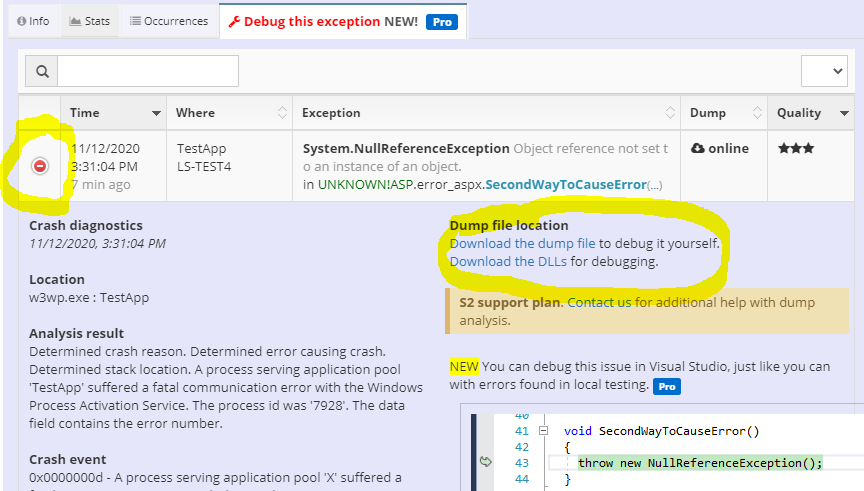
To view the dump files generated, select a website and go to it's Errors tab. Then, select the error with error debugging enabled, and go to it's "Debug this exception" tab:
NEW Debug dumps without symbols, sources, or DLLs
LeanSentry now provides the ability to set up your local dev environment for debugging production dumps even if you do not have matching sources, symbols, and DLLs. To learn more, see Debug production dumps without symbols, sources, and DLLs.
