Using CPU Diagnostics
LeanSentry's CPU diagnostics monitor the CPU usage of your applications and automatically diagnose it to help you:
- Troubleshoot high CPU usage and performance regressions.
- Proactively improve application performance.
- Reduce server costs by hosting your workload with fewer servers!
How it works
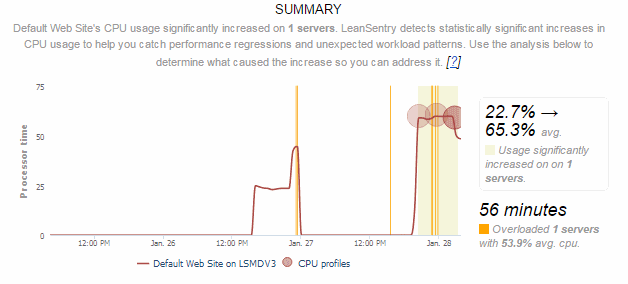
We monitor the CPU usage of your servers, websites, and processes, and automatically detect situations such as processor overload, abnormal increases in CPU usage, and so on.
Then, we'll automatically analyze the CPU usage of the relevant applications using a lightweight + non-intrusive CPU profiler technology. This typically lasts 30 seconds, uses <10% of your server's processor, and *cannot slow down or crash* your application.
Automatic insights
We'll automatically notify you if we detect processor overload, a performance regression, or an opportunity to improve application performance. This way, you can stay on top of your application performance without an upfront comittment to performance testing.

Using CPU diagnostic reports to tune CPU usage
We designed the LeanSentry CPU diagnostic reports to simplify the process of tuning your application.
1. First, we identify what % of the CPU used was due to application code, vs. .NET framework's internal processes of Garbage collection, JIT compilation, and assembly loading.

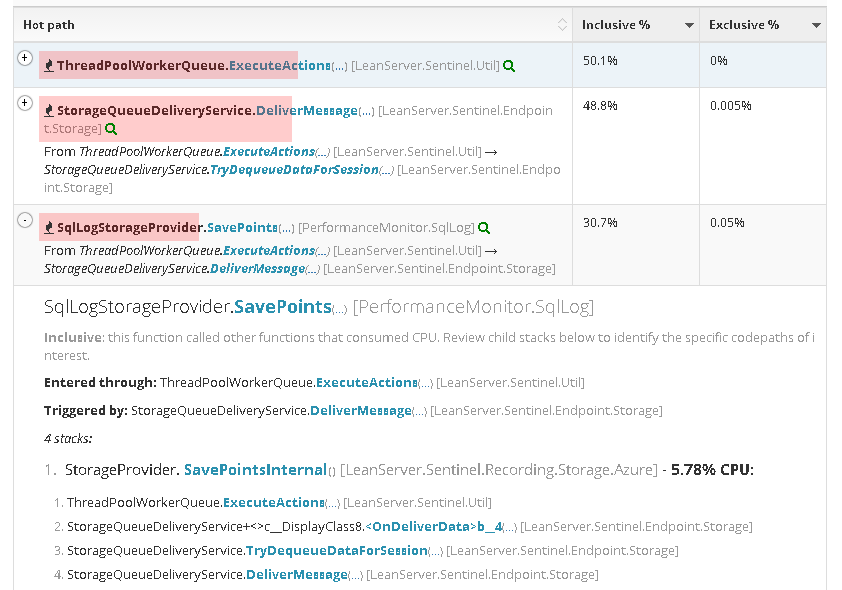
2. Second, we automatically identify the hot paths in your code responsible for most of the CPU usage.

Each hot path represents a unique vector in your code that caused significant CPU usage, including both "inclusive" usage (usage that includes all child functions called) and "exclusive" usage (the usage of the function itself).
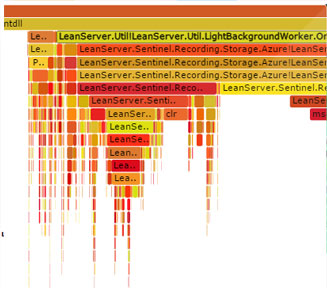
3. Finally, we provide a fully-interactive flame graph of the application's CPU usage.
This is an incredibly simple and powerful way to explore the CPU cost of your code, and identify opportunities to improve it. You can click any of the nodes in the graph to zoom into them and see their child functions in more detail - then click the parent node to zoom back out.

TIP: Your developers can quickly tune the application by reducing calls to large sub-trees of the graph (inclusive functions), or optimizing the implementation of large leaf nodes in the graph (exclusive functions).
Additional configuration options
You can tune the settings for automatic CPU diagnostics to better suit your needs:
1. Edit the environment-level CPU diagnostic settings to tweak the server's CPU usage that triggers automatic diagnostics.
2. Edit website or process-level CPU diagnostic settings to enable proactive diagnostics for a website or process of interest.
You can find these settings by clicking "CPU diagnostics" on the main dashboard's right panel, or selecting a specific website or process in the real-time "Websites and processes" tool.
Diagnosing on-demand
To diagnose an application on-demand, click "Diagnose now" link next to "CPU diagnostics" on the main dashboard's right panel, or by opening the diagnostic settings for a specific website or process in the real-time "Websites and processes" tool.
Need help?
Have a question or feedback on CPU diagnostics? Email us at support@leansentry.com.
