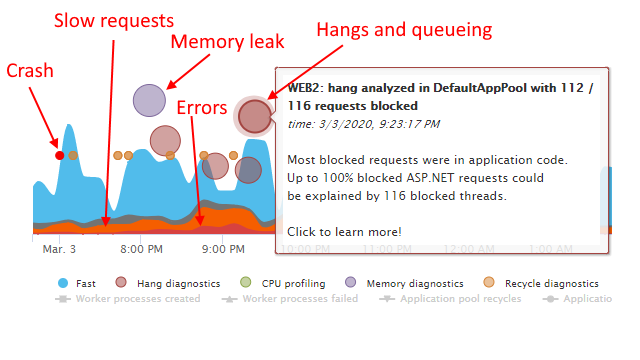
In part 1 of our IIS logs monitoring guide, I outlined the key questions that you can answer from your logs to get ACTIONABLE insight into your website’s quality of service.
I.e., the questions actually worth asking about your website.
However, I also detailed the limitations of IIS logging that can prevent you from ever fixing the issues you identify :(
- Website requests failing with errors? We don’t know the exception details behind those IIS 500 errors, so your developers probably won’t look at them.
- Is it the server or the code? There is nothing in the logs indicating any server-wide conditions that may have affected the requests.
- Slow requests? There is nothing in the logs to tell you which code caused it.
If only we can combine the measurable website service level metrics in IIS logs, with actionable details on what caused your slow and failed requests, you would then be able to prioritize AND actually fix your website issues.
In part 2 of our IIS logging guide, we’ll look at actually adding the critical missing details into your IIS logs.
The IIS log details you’ve always wanted
Here are the things we’ll be able to add directly into your website logs:
Error details including exception type, method, and line number

With this, you can go WAY beyond the normal IIS 500 error logging. For every failed request, get full exception details, including exception type, message, and even line numbers if the stack trace contains them. We’ll automatically group related errors so you can deal with unique errors, not millions of error variants.
Server and website issues causing slow requests, including hangs, CPU overload, and more

Tag each slow request with the contributing server or website level issue, like hangs, CPU overloads, etc. This lets you separate regular slow application code from bigger issues, and prioritize those issues for further investigation.
The application code causing slow requests

This will mark each slow request with the longest tracked code operation during the request. So you can report on root causes of the slowdowns straight from the IIS log.
Make IIS log analysis relevant to your website
Data is great, but it’s not relevant unless it aligns with your website structure and priorities. This has never been feasible with IIS logs or any IIS log analyzers I’ve used, without dumping results into spreadsheets with a whole lot of data manipulation. And who has time for that?
With the additional fields we’ll add, you’ll be able to directly query your IIS logs with your site priorities taken into account.
E.g.:
- Prioritizing important URLs for satisfaction score measurement.
- Customize your target SLA thresholds per request/URL.
- Segregating your traffic by arbitrary tags and area.
- Reporting on application execution time instead of time-taken/TTLB.
- And more ...
Best of all, you’ll be able to get (almost) all of these enhancements without writing a single line of code.
How to enrich your IIS logs
The plan is simple.
- We’ll leverage Enhanced IIS logging, a feature built into IIS 8.5 and above, which lets us add custom IIS log fields.
- We’ll add a set of fields that enrich our IIS logs with crucial details on slow and failed requests.
- We’ll supply the data for those fields using LeanSentry.ApplicationMonitoring.dll, a free component of LeanSentry that anyone can drop into their website’s /BIN directory. The library sources a lot of the additional information LeanSentry uses to detect and diagnose issues, but it works just fine without LeanSentry installed (for most scenarios).
Just like that, a few small tweaks to your website configuration will take your IIS logs to that next level. It should also work with any IIS log reader or parser that you are using, as long as they support custom fields. I am going to be using Log Parser as I did in part 1.
Add custom IIS log fields with ApplicationMonitoring.dll
You can manually add support for the custom fields we will recommend by adding the required code to your application.
You can also invent your own wheel, and grow your own vegetables.
(My mom does grow some amazing vegetables, but I usually just get my vegetables from our local farmers market.)
So, we’ve added all these fields to our lightweight IIS monitoring DLL that you can drop into your application. LeanSentry customers use this DLL to provide some additional information to LeanSentry, but you can add it without LeanSentry on the server to get all the IIS log fields yourself.
Download and add the LeanSentry.ApplicationMonitoring.dll to your website here. For more instructions on how to add it to your application: Tracking application code operations with LeanSentry.ApplicationMonitoring.dll.
Once you’ve added the library to your app, run this command to add the fields to your IIS log field definition:
%windir%\system32\inetsrv\appcmd set site "SITENAME" /+logFile.customFields.[logFieldName='ErrorId',sourceName='LS_ERROR_ID',sourceType='ServerVariable'] /+logFile.customFields.[logFieldName='ErrorId2',sourceName='LS_ERROR_ID2',sourceType='ServerVariable'] /+logFile.customFields.[logFieldName='ErrorKind',sourceName='LS_ERROR_CAT',sourceType='ServerVariable'] /+logFile.customFields.[logFieldName='ErrorType',sourceName='LS_ERROR_TYPE',sourceType='ServerVariable'] /+logFile.customFields.[logFieldName='ErrorMethod',sourceName='LS_ERROR_METHOD',sourceType='ServerVariable'] /+logFile.customFields.[logFieldName='ErrorMessage',sourceName='LS_ERROR_MESSAGE',sourceType='ServerVariable'] /+logFile.customFields.[logFieldName='ErrorSource',sourceName='LS_ERROR_SOURCE',sourceType='ServerVariable'] /+logFile.customFields.[logFieldName='SLATime',sourceName='LS_SLA_TIME',sourceType='ServerVariable'] /+logFile.customFields.[logFieldName='Importance',sourceName='LS_IMPORTANCE',sourceType='ServerVariable'] /+logFile.customFields.[logFieldName='SessionId',sourceName='LS_SID',sourceType='ServerVariable'] /+logFile.customFields.[logFieldName='UID',sourceName='LS_UID',sourceType='ServerVariable'] /+logFile.customFields.[logFieldName='Area',sourceName='LS_AREA',sourceType='ServerVariable'] /+logFile.customFields.[logFieldName='Tags',sourceName='LS_TAGS',sourceType='ServerVariable'] /+logFile.customFields.[logFieldName='IssueCode',sourceName='LS_ISSUE_CODE',sourceType='ServerVariable'] /+logFile.customFields.[logFieldName='LongestOp',sourceName='LS_LONGEST_OP',sourceType='ServerVariable'] /+logFile.customFields.[logFieldName='LS_Extensions',sourceName='LS_EXTENSIONS',sourceType='ServerVariable']
(Note: This command configures these fields for a specific website, but you can also set them as website defaults for all sites on the server. That's what we do.)
After your application pool recycles, your IIS logs look like this:
#Software: Microsoft Internet Information Services 10.0
#Version: 1.0
#Date: 2021-07-03 05:24:23
#Fields: date time s-ip cs-method cs-uri-stem cs-uri-query s-port cs-username c-ip cs(User-Agent) cs(Referer) sc-status sc-substatus sc-win32-status sc-bytes cs-bytes time-taken ErrorId ErrorId2 ErrorKind ErrorType ErrorMethod ErrorMessage ErrorSource SLATime Importance SessionId UID Area Tags IssueCode LS_Extensions
We’ll get into the details of these fields and how they boost your IIS log insight next.
Fix IIS website issues with enhanced IIS logs
Now that we have the fields added, and ApplicationMonitoring.dll added to your app, it’s time to dig in.
Get actionable error details from your IIS logs
There is a world of difference between knowing that IIS 500.0 errors are causing failed requests in your site, and having the exact exceptions and stack traces you can give your developers to fix.
Even if you have a separate error log, it does not connect directly to IIS log errors, so it’s hard to draw a direct connection between failing requests impacting your satisfaction score, and the exceptions causing it.
That’s where the new error fields come in. ApplicationMonitoring.dll will automatically set the detailed error information on the request, causing exception details to be populated for EACH failed request in your IIS log:
#Software: Microsoft Internet Information Services 10.0
#Version: 1.0
#Date: 2021-07-03 01:08:57
#Fields: date time s-ip cs-method cs-uri-stem cs-uri-query s-port cs-username c-ip cs(User-Agent) cs(Referer) sc-status sc-substatus sc-win32-status sc-bytes cs-bytes time-taken ErrorId ErrorId2 ErrorKind ErrorType ErrorMethod ErrorMessage ErrorSource

2021-07-03 01:08:57 ::1 GET /test.aspx 8990 - ::1 - - 500 0 0 5173 49 2 c5160969-5630-a8d0-90dd-dc1d1c1b989a 868b08ff-3e06-cd1c-50f6-ad7fd26605f9 ASPNET InvalidOperationException ASP.test_aspx.Page_PreRender I+failed+you! c:\repos\LeanSentry\Source\Testing\TestApp\test.aspx:line+63
2021-07-03 01:08:57 ::1 GET /test.aspx 8990 - ::1 - - 500 0 0 5173 49 2 c5160969-5630-a8d0-90dd-dc1d1c1b989a 868b08ff-3e06-cd1c-50f6-ad7fd26605f9 ASPNET InvalidOperationException ASP.test_aspx.Page_PreRender I+failed+you! c:\repos\LeanSentry\Source\Testing\TestApp\test.aspx:line+63
2021-07-03 01:08:57 ::1 GET /test.aspx 8990 - ::1 - - 500 0 0 5173 49 2 c5160969-5630-a8d0-90dd-dc1d1c1b989a 868b08ff-3e06-cd1c-50f6-ad7fd26605f9 ASPNET InvalidOperationException ASP.test_aspx.Page_PreRender I+failed+you! c:\repos\LeanSentry\Source\Testing\TestApp\test.aspx:line+63
This gives you the following details for each failed request:
- ErrorId, ErrorId2: Unique error ids we compute for distinct errors.
- ErrorType: The exception type.
- ErrorMethod: The application code method triggering the exception.
- ErrorMessage: The exception message (not the whole thing, a short preview of it).
- ErrorSource: The file and line number for the source code location of the exception, if available.
Then, you can run your logparser query to break down your failed requests by each specific error type:
-- Break down error sat score impact error, using the new exception fields!
select
    sc-status,
    sc-substatus,
    ErrorId,
    ErrorType,
    ErrorMethod,
    ErrorSource,
    -- Percent of traffic
    COUNT(*) AS REQUESTS_FAILED, ROUND(MUL(PROPCOUNT(*), 100)) AS PERCENT_REQUESTS_FAILED_SITE
FROM C:\inetpub\logs\LogFiles\W3SVC4\*_x.log
GROUP BY sc-status, sc-substatus, ErrorId, ErrorType, ErrorMethod, ErrorSource
HAVING sc-status >= 399
ORDER BY REQUESTS_FAILED DESC
Now this is something you can pass on to your developers, along with the clear justification for why this error is important to fix. Hey Bill, can you fix that NullReferenceException on line X, it’s killing our Login page sat score!

ApplicationMonitoring.dll will automatically group related exceptions into unique error ids, so instead of 1000s of different entries, you’ll get a handful of errors with meaningful total error counts. This works the exact same way as our error grouping in LeanSentry, so they’ll match up 1:1.
Tracking errors across the entire IIS/ASP.NET stack with LeanSentry
If you want to step up your production error fixing game, check out LeanSentry Error diagnostics. LeanSentry track errors across the entire IIS stack, including HTTP.SYS errors, IIS errors, application pool and worker process failures, as well as ASP.NET application exceptions. This makes sure no failures escape visibility (unlikle your IIS log which only sees IIS worker process errors).
With the added benefit of LeanSentry diagnostics, your developers can get complete application dumps for hard to reproduce exceptions, so they can debug them in Visual Studio as if they were happening locally.
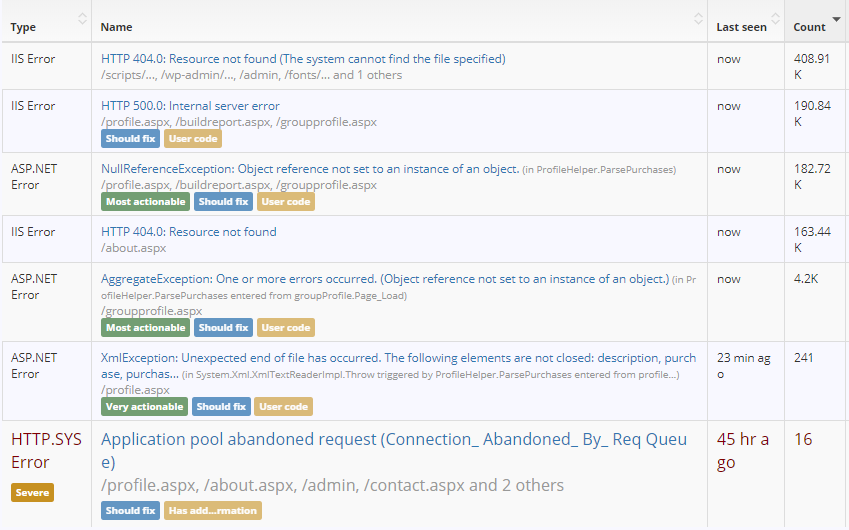
For more, check out Fix IIS, ASP.NET, ASP, and Http.sys errors.
P.S. If you are running PHP applications, you can also route detailed PHP errors to this system as well! We'll publish a blog post on how to do this shortly.
See which application code caused slow IIS requests
Referencing LeanSentry.ApplicationMonitoring.dll gives you the ability to mark parts of your application code with trackers. The library automatically adds a few trackers to things like MVC controller actions, but you can also add lightweight trackers around your code like this:
using(new Tracker("Connecting to SQL"))
{
    // your code here
}
Even if you don’t have LeanSentry, the library remembers the longest tracker seen for the request, and will emit that tracker’s hierarchical name to the log.
With this, you can now instantly see the longest tracked operation causing slow requests in your IIS logs:

By using the query that measures satisfaction score penalties, you can then report the operations by the impact they have to the quality of service for your website (or a specific URL).
-- Break down satisfaction penalty to the website by issue code
select
	LongestOp,
	-- Sat score components:
	COUNT(*) AS TOTALREQUESTS,
	SUM(CASE DIV(sc-status,399) WHEN 0 THEN 0 ELSE 1 END) AS FAILEDREQUESTS,
	SUM(CASE DIV(time-taken,2000) WHEN 1 THEN 1 WHEN 2 THEN 1 WHEN 3 THEN 1 ELSE 0 END) AS SLUGGISHREQUESTS,
	SUM(CASE DIV(time-taken,8000) WHEN 0 THEN 0 ELSE 1 END) AS SLOWREQUESTS,
	-- SAT score:
	ROUND(DIV(TO_REAL(MUL(SUB(SUB(SUB(TOTALREQUESTS, FAILEDREQUESTS), SLOWREQUESTS), DIV(SLUGGISHREQUESTS,2)),100)), TO_REAL(TOTALREQUESTS))) AS SATSCORE,
	-- SAT score penalty (to the site):
	MUL(PROPCOUNT(*), SUB(100.0, DIV(TO_REAL(MUL(SUB(SUB(SUB(TOTALREQUESTS, FAILEDREQUESTS), SLOWREQUESTS), DIV(SLUGGISHREQUESTS,2)),100)), TO_REAL(TOTALREQUESTS)))) AS SATSCORE_PENALTY
FROM C:\temp\u_ex210709_x\*.log
GROUP BY LongestOp
ORDER BY SATSCORE_PENALTY DESC
You can start by adding just a few trackers to common operations inside your codebase, e.g. your data retrieval APIs. This way, even if you don’t have trackers on all pages, you’ll see whenever those APIs contribute to your page execution times.
Another approach is to first identify the URLs with slow requests in your website, and then add trackers to those urls to start identifying the slow operations.
With this targeted approach you pay no performance penalty, as compared to APM tools that intercept method calls across your entire application.
Slow request tracking in LeanSentry
A cool side benefit of adding trackers is that if you want to try LeanSentry, you’ll already be in a great position to benefit from LeanSentry’s slow operation tracking (which use the trackers as one of the data sources for slow requests).
Then, you can see which parts of your code cause the most slow requests for your website, specific URLs, and so on:
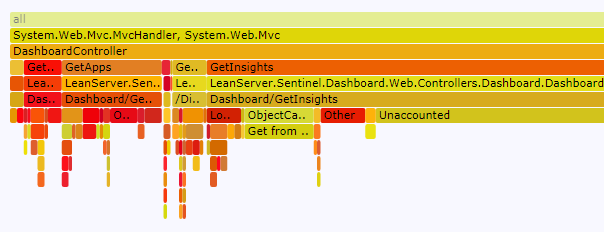
As a bonus, LeanSentry can also report on the CPU usage of your trackers, so you can also find the CPU hotspots in your code without doing any kind of profiling!
Get lightweight issue tagging for each slow request
Remember how in part 1 of the IIS logs analysis guide we established that we don’t really know what caused a hang in the IIS logs, without having a Hang diagnostic tool like LeanSentry to give us the detailed analysis?
Without that diagnostic report, you can never be sure whether a bunch of slow requests were caused by a hang or CPU overload, or just slow application code. You’ll be easily sent back into the age old “Was it the app? Was it the server? Was it aliens?” rabbit hole.
BUT ... If you do have LeanSentry on server and ApplicationMonitoring.dll in your app, you can log a simple issue code for each request that tells you whether the request was affected by a hang / any other performance issue LeanSentry has identified at the time.
While this issue code won’t tell you the application code causing the problem, it will at least tell you what kind of issue caused it.
This gives you the following benefits:
- You can know whether slow requests were just slow code, or affected by server or website-level issues.
- You can prioritize the top issues for further investigation.
- You can calculate exactly how many slow requests/sat score penalty were associated with specific server or application issues.
Here is the query, similar to sat score penalty by URL, but this time by issue code.
-- Break down satisfaction penalty to the website by issue code
select
	IssueCode,
	-- Sat score components:
	COUNT(*) AS TOTALREQUESTS,
	SUM(CASE DIV(sc-status,399) WHEN 0 THEN 0 ELSE 1 END) AS FAILEDREQUESTS,
	SUM(CASE DIV(time-taken,2000) WHEN 1 THEN 1 WHEN 2 THEN 1 WHEN 3 THEN 1 ELSE 0 END) AS SLUGGISHREQUESTS,
	SUM(CASE DIV(time-taken,8000) WHEN 0 THEN 0 ELSE 1 END) AS SLOWREQUESTS,
	-- SAT score:
	ROUND(DIV(TO_REAL(MUL(SUB(SUB(SUB(TOTALREQUESTS, FAILEDREQUESTS), SLOWREQUESTS), DIV(SLUGGISHREQUESTS,2)),100)), TO_REAL(TOTALREQUESTS))) AS SATSCORE,
	-- SAT score penalty (to the site):
	MUL(PROPCOUNT(*), SUB(100.0, DIV(TO_REAL(MUL(SUB(SUB(SUB(TOTALREQUESTS, FAILEDREQUESTS), SLOWREQUESTS), DIV(SLUGGISHREQUESTS,2)),100)), TO_REAL(TOTALREQUESTS)))) AS SATSCORE_PENALTY
FROM C:\temp\u_ex210709_x\*.log
GROUP BY IssueCode
ORDER BY SATSCORE_PENALTY DESC
(You can of also break down by issue code AND url, if you want, although for site-level issues like hangs you may get results for too many urls since they are all affected. I recommend breaking down the null issue code or LS_Issue_Slowdown by URL.)
Here it is:

Automatically diagnose IIS website hangs, CPU overloads, queueing etc
If you want to quickly resolve IIS hangs and other performance degradation incidents, check out LeanSentry. LeanSentry Hang diagnostics were developed specifically to recognize common IIS and ASP .NET issues and diagnose them exactly when they happen.
LeanSentry continuously monitors your IIS application pools for signs of hangs, in a way that requires no invasive profilers. If a hang is detected, LeanSentry occasionally performs a full diagnostic to identify the cause of the hang down to the app code.
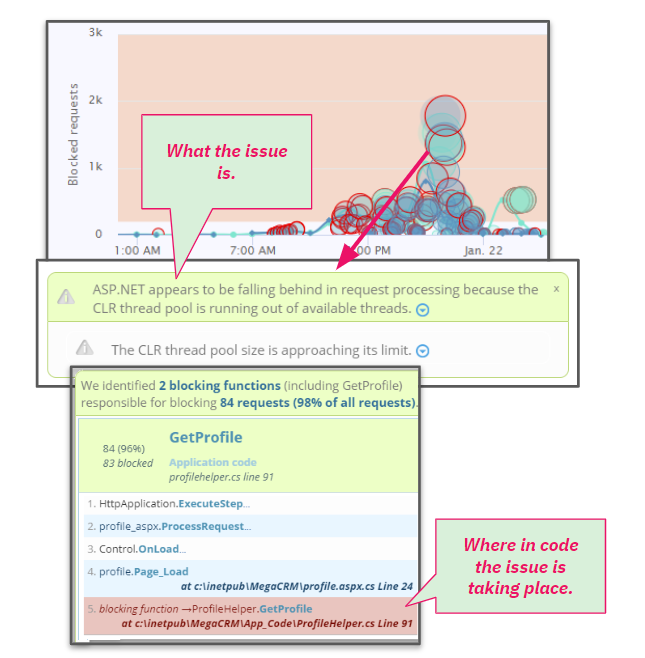
For more, see LeanSentry Hang diagnostics.
Get a more relevant satisfaction score for your IIS site
In part 1 of the IIS logging guide, we introduced the Satisfaction score as a better measure of quality of service for your IIS website.
This score relies on defining a fast response SLA time to categorize each request as fast, sluggish, or slow.
So far, we’ve been applying a single default SLA of 2 seconds to your entire website. This makes calculating the Satisfaction score for the site simple, but it’s just not realistic. To make our Satisfaction score a more accurate measure of the quality of service for your site, you may want to:
- Set different SLAs for different parts of your application.
- Ignore some requests or URLs for the purposes of the Satisfaction score.
- Assign higher priority to other requests or URLs.
For example, your cart or your login page being slow should have a lot more weight than some frequently hit, but less important page. Similarly, some frequently failing (but non-critical) API calls should not skew your satisfaction score and you may want to just ignore them.
We added support for this as well so you can do this simply through the ApplicationMonitoring.dll library (just be sure to reference it into your app, not just /BIN it). For example, say you have a very important action /Cart/Purchase that may sometimes take 5s and still be considered fast. You can add this code in the action:
public ActionResult Purchase()
{
    HttpContext.SetSlaTime(5000); // be sure to import the LeanSentry.ApplicationMonitoring namespace
    HttpContext.SetImportance(5); // set 0 to ignore request/exclude from SAT score

    ...
}
The logs now contain:
#Software: Microsoft Internet Information Services 10.0
#Version: 1.0
#Date: 2021-07-03 03:53:45
#Fields: date time s-ip cs-method cs-uri-stem cs-uri-query s-port cs-username c-ip cs(User-Agent) cs(Referer) sc-status sc-substatus sc-win32-status sc-bytes cs-bytes time-taken ErrorId ErrorId2 ErrorKind ErrorType ErrorMethod ErrorMessage ErrorSource SLATime Importance


2021-07-03 03:55:42 ::1 GET /Cart/Purchase 8990 - ::1 Mozilla/5.0+(Windows+NT+10.0;+Win64;+x64)+AppleWebKit/537.36+(KHTML,+like+Gecko)+Chrome/91.0.4472.124+Safari/537.36 - 200 0 0 204 981 4804 - - - - - - - 5000 5
We can now obtain an importance-weighted, SLA-conscious Satisfaction score for the website and individual URLs:
-- Select components of satisfaction score, with request importance weighting AND per-request SLA times
select
	-- Sat score components:
	COUNT(*) AS TOTALREQUESTS,
	-- Use importance as the value of the request (1 by default, ignore 0)
	SUM(COALESCE(TO_REAL(Importance), 1.0)) AS TOTALREQUESTVALUE,
	SUM(CASE DIV(sc-status,399) WHEN 0 THEN 0 ELSE 1 END) AS FAILEDREQUESTS,
	SUM(CASE DIV(sc-status,399) WHEN 0 THEN TO_REAL(0) ELSE COALESCE(TO_REAL(Importance), 1.0) END) AS FAILEDREQUESTVALUE,
	-- Use the SLA Time of each request (Sluggish = 1x-4x SLA) or 2000ms if not specified
	SUM(CASE DIV(time-taken, COALESCE(TO_INT(SLATime),2000)) WHEN 1 THEN COALESCE(TO_REAL(Importance), 1.0) WHEN 2 THEN COALESCE(TO_REAL(Importance), 1.0) WHEN 3 THEN COALESCE(TO_REAL(Importance), 1.0) ELSE TO_REAL(0) END) AS SLUGGISHREQUESTS,
	SUM(CASE DIV(time-taken, COALESCE(TO_INT(SLATime),2000)) WHEN 1 THEN COALESCE(TO_REAL(Importance), 1.0) WHEN 2 THEN COALESCE(TO_REAL(Importance), 1.0) WHEN 3 THEN COALESCE(TO_REAL(Importance), 1.0) ELSE 0.0 END) AS SLUGGISHREQUESTVALUE,
	SUM(CASE DIV(time-taken,COALESCE(MUL(TO_REAL(SLATime),4), TO_REAL(8000))) WHEN 0 THEN TO_REAL(0) ELSE COALESCE(TO_REAL(Importance), 1.0) END) AS SLOWREQUESTS,
	SUM(CASE DIV(time-taken,COALESCE(MUL(TO_REAL(SLATime),4), TO_REAL(8000))) WHEN 0 THEN TO_REAL(0) ELSE COALESCE(TO_REAL(Importance), 1.0) END) AS SLOWREQUESTVALUE,
    -- SAT score:
	ROUND(DIV(TO_REAL(MUL(SUB(SUB(SUB(TOTALREQUESTVALUE, FAILEDREQUESTVALUE), SLOWREQUESTVALUE), DIV(SLUGGISHREQUESTVALUE,2)),100)), TO_REAL(TOTALREQUESTVALUE))) AS SATSCORE
FROM C:\inetpub\logs\LogFiles\W3SVC4\u_ex210703_x_1.log
Here is the result:

This calculation automatically honors priorities, SLA thresholds, and ignoring urls (to ignore a request, set it’s priority to 0).
Now, you may be able to report the modified Satisfaction as a true measure of your site’s health.
Track sessions and public site users, query logs by application area and tags, and more
The set of fields we recommend cover a number of other tasty reporting scenarios, that we’ll cover in subsequent posts. These include:
- Track requests by session id (e.g. to debug session locking issues)
- Identify public website users by their client-side id
- Report website service level, errors, and slow requests for different sub-areas of your site, as defined by the area and tag fields.
- And more.
We’ll blog more about these in the next several weeks.
Conclusion
In part 1 of the IIS log analysis guide, we’ve gone from “IIS logs, what is it” to a simple, systematic process you can follow to measure your website’s quality of service, and break it down into issues that reduce it (slow and failed requests).
Then, in this part 2, we used IIS 8.5 Enhanced logging and ApplicationMonitoring.dll to add the crucial details you need to fix the issues, straight to your IIS logs.
If you implement this guidance for your site, you will be able to complete the cycle:
- Measure website’s quality of service (taking into account custom SLAs and URL priorities), and break it down for reporting using custom areas and tags.
- Identify sources of failed and slow requests.
- Get detailed exception information for failed requests (that your developers can work on).
- Get a clear understanding of what caused your slow requests, including server issues and the slow application code.
By connecting the website satisfaction score penalties of issues with the details you need to fix them … you can finally make actionable, prioritized, and convincing list of issues that your team will want to fix to improve your website’s health.
P.S. Using this guide and ApplicationMonitoring.dll to amp up your IIS log insights? Please comment below, and share your questions/success stories.
P.P.S. If you are struggling with IIS hangs, CPU overloads, memory leaks and the like, deploy LeanSentry to diagnose and fix those issues down to the application code.
