find and fix:
- Slow requests
- Lock contention
- Errors
- Classic ASP
- Recycling
- and more ...
Used by 10,000+ companies to solve real performance issues.
Dan O'Connell
Senior Developer, Millstone Medical
This is a fantastic product. We were able to improve speed noticeably
on a horrow-show of a server. Seriously, this is really good stuff...
you're going to make a hero out of me.
Safer & lower overhead
than your current application performance monitoring tool.
![]()
![]() external
non-blocking
external
non-blocking
![]()
![]() APM side-by-side
APM side-by-side
Lightweight, non-intrusive monitoring
LeanSentry uses external, low-overhead monitoring based on IIS log files, performance counters, WMI, and ETW tracing.
Unlike an APM tool, we do not attach any profilers or inject agents into your process that can crash or slow down your apps.
Automatic diagnostics
LeanSentry automatically detects hangs, high CPU usage, or memory leaks - and performs deeper diagnostics to get you code-level details.
These diagnostics typically last seconds, and give you the details you need at the right time.
24/7 coverage
![]()
![]()
Safe and secure
LeanSentry collects non-sensitive data that is considered safe to log to standard Windows logs. It does not access your application's memory, data, and code.
Locked down environment? Use LeanSentry OnPremise to host your own data with no outside communication.
![]()
About Us
Mike Volodarsky founded LeanSentry after working on the IIS 7.0 and ASP.NET 2.0 products at Microsoft.
LeanSentry is based on tools and techniques developed while working with some of the largest Microsoft-based websites in the world, including MySpace, Vevo, Microsoft mobile, and hundreds of others.
See what you've been missing.
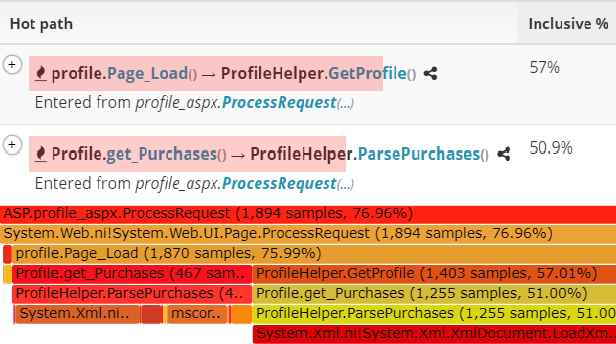
See what really causes your performance issues
Diagnose slow requests and website hangs down to the code. LeanSentry understands concurrency limits, threading issues, and queueing and can find your application code that's causing it.
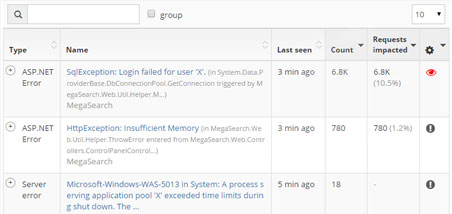
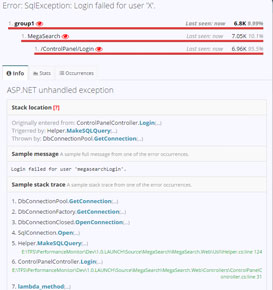
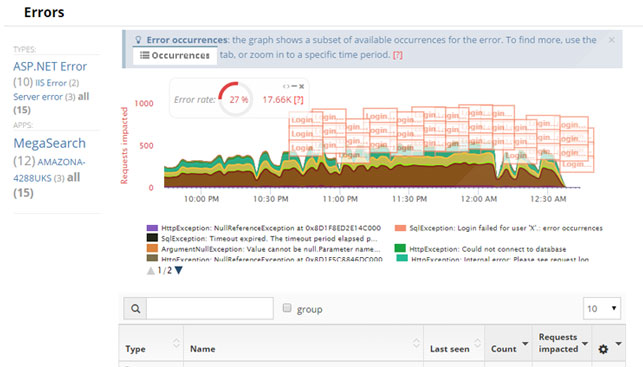
Find and fix errors across entire server stack
Track errors across your entire stack, including your server, IIS, ASP.NET, and your application. Give your developers the details they need to fix errors quickly.
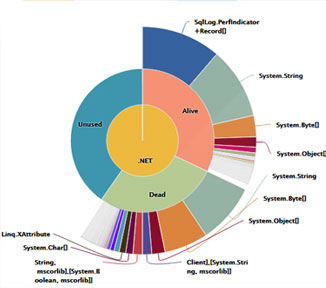
Optimize .NET performance
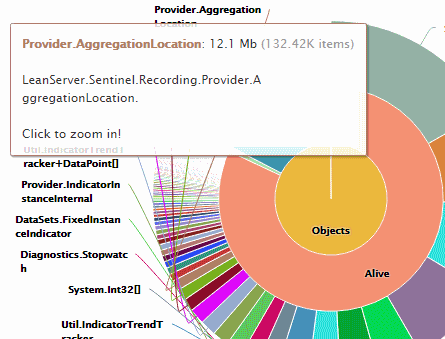
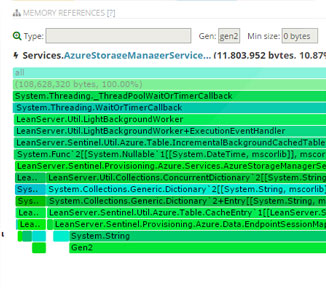
Tune memory usage
Troubleshooting memory leaks in production can be incredibly hard.
LeanSentry automatically tracks memory leaks, and helps you proactively tune your app's memory usage.
- See exactly where memory was allocated.
- Understand how .NET Garbage collection affects your performance.
- Track .NET memory usage down to code.
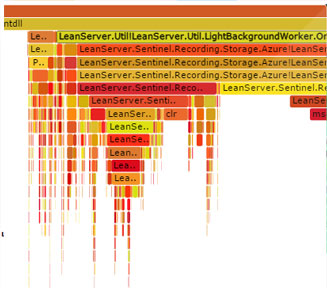
Tune CPU usage
Troubleshoot high CPU usage, or reduce your app's CPU overhead to save your server costs.
- Near-continuous CPU usage history down to application code.
- Low overhead with no heavy profilers.
Track down performance regressions and validate improvements, without doing extensive performance testing.
Run IIS & ASP.NET web apps? You are going to like this.
Deploy in 5 minutes. No iisreset. Runs safely alongside other APMs.
![]()
For Operations
![]()
For Developers
![]()
For Developers
![]()
For Teams
![]()
Application Health
Quickly track health and performance.
![]()
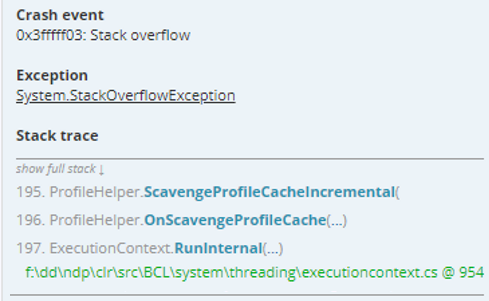
Request Debugger
Get full request traces for errors and slow requests. Log custom data into the trace.
![]()
Reduce Testing Costs
Save time and get better results: let your developers tune performance in production.
![]()
Alerts
Get notified on slow pages, errors, low memory, high CPU, and more.
![]()
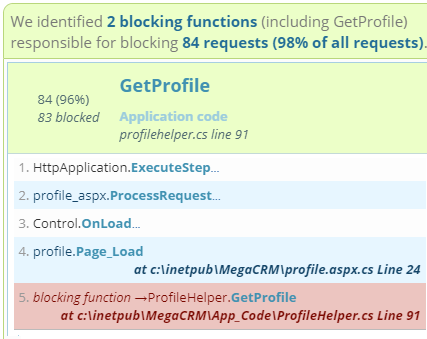
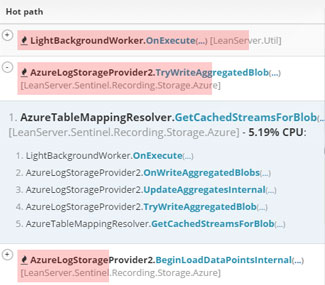
Identify Slow Code
Identify slow functions blocking requests, down to line of code.
![]()
Boost App Performance
Expert insight makes it easier for your team to improve and maintain high performance.
![]()
Get the Evidence
Is the server or the code? We'll tell you. Simply link your teammates to the evidence.
![]()
Go Straight to Fixing
Get the full info on issues: stack traces, CPU trees, memory graphs. No guessing, setting up repros, and production debugging.
![]()
Slash Server Costs
Because tuning CPU and memory is so easy, you can reduce your footprint and run it with fewer servers in no time.
![]()
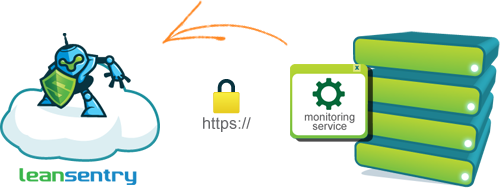
Cloud
Deploy LeanSentry to your servers, and view diagnostics in minutes on our online dashboard.
Your Environment
![]()
Web servers
Deploy and start diagnosing in 5 minutes.
Get deep insight and automatic diagnostics in 5 minutes.
No reboot/IISRESET, safe for live servers.
Deploy to dedicated servers, Azure cloud services, and Amazon EC2.
Great for ASP.NET and Clasic ASP apps.
![]()
Enterprise
Host the entire LeanSentry stack in your environment.
Your Environment
![]()
Web servers
Works with locked down environments, no outgoing internet connection required.
Comply with stringent security or privacy requirements by storing all data within your environment.
![]() Our customers say
Our customers say
In the first 3 weeks of use, we resolved 3 production issues affecting performance and availability. LeanSentry is now our go to tool for insight into how our applications are running.
![]() Steven Berkovitz
,
Platform Architect, OrderDynamics
Steven Berkovitz
,
Platform Architect, OrderDynamics
Great product & company to work with. Ex MS guys who know IIS and the MS stack. You work with the team directly, not a customer care layer. LeanSentry uncovers things in minutes vs. days of digging.
![]() Dan Foxley
,
Operations Manager, Pacific DataVision
Dan Foxley
,
Operations Manager, Pacific DataVision
I have not seen a service that provides so much information with so little setup. LeanSentry made it simple to diagnose errors and slowdowns, and gave us a way to measure our success in resolving application issues.
![]() Ed W.
,
Web Developer, InfoTrack
Ed W.
,
Web Developer, InfoTrack
We were seeing severe hangs on our ASP.NET site.
Looked at what LeanSentry said was the cause of the hang,
disabled that code, and it’s been smooth sailing since.
![]() Thomas Nielsen
,
CEO, Progressive Media
Thomas Nielsen
,
CEO, Progressive Media


Dan O'Connell
Senior Developer, Millstone Medicalon a horrow-show of a server. Seriously, this is really good stuff...
you're going to make a hero out of me.
Safer & lower overhead
than your current application performance monitoring tool.
LeanSentry uses external, low-overhead monitoring based on IIS log files, performance counters, WMI, and ETW tracing.
Unlike an APM tool, we do not attach any profilers or inject agents into your process that can crash or slow down your apps.
LeanSentry automatically detects hangs, high CPU usage, or memory leaks - and performs deeper diagnostics to get you code-level details.
These diagnostics typically last seconds, and give you the details you need at the right time.
access
LeanSentry collects non-sensitive data that is considered safe to log to standard Windows logs. It does not access your application's memory, data, and code.
Locked down environment? Use LeanSentry OnPremise to host your own data with no outside communication.
LeanSentry is based on tools and techniques developed while working with some of the largest Microsoft-based websites in the world, including MySpace, Vevo, Microsoft mobile, and hundreds of others.