Many modern ASP.NET applications are developed using the asynchronous task pattern. This pattern helps reduce the thread pool exhaustion issues traditionally associated with synchronous applications.
That said, async ASP.NET applications can and do still experience hangs!
Worse yet, hangs in async applications can be WAY harder to diagnose, because blocking asynchronous tasks have no readily apparent “stacks” showing where the code is blocked.
In this how-to, we’ll look at how to use LeanSentry Hang diagnostics to diagnose and fix async hangs.
What is an async hang?
An async hang is simply a hang that takes place in an asynchronous application, e.g. an application using the async/await pattern. From the standpoint of your website users, the symptoms are the same:
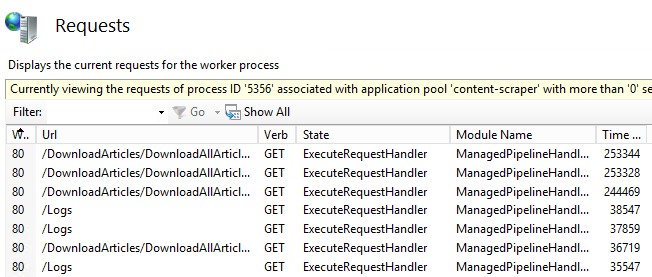
- Requests are queueing up (Using InetMgr Current Requests or Appcmd List Requests)
- IIS “Active Requests” performance counter is increasing quickly: W3SVC_W3WP\Active Requests.
- Your website is not responding/loading very slowly.
You can read more about identifying and diagnosing hangs in our Diagnose IIS website hangs guide.
What is the difference between an async hang and a synchronous hang?
In a synchronous application, a hang is almost always associated with a number of threads becoming blocked in synchronous application code. As a result, if inspecting the hang under a debugger, you can observe those threads and identify the stack traces where blockage is taking place:
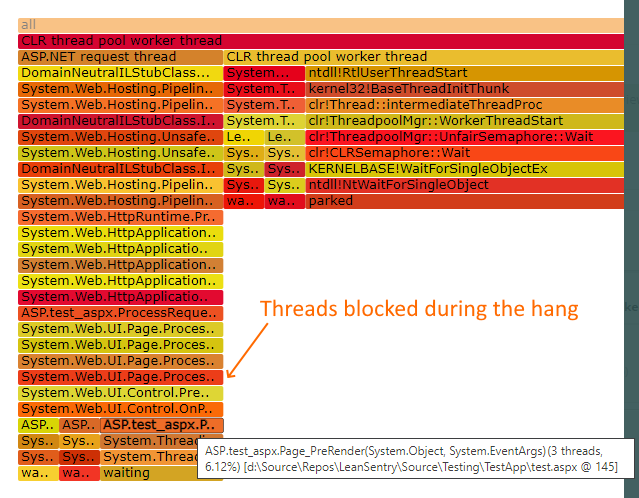
You can then inspect the blocked threads to identify where the code is becoming blocked, for example:

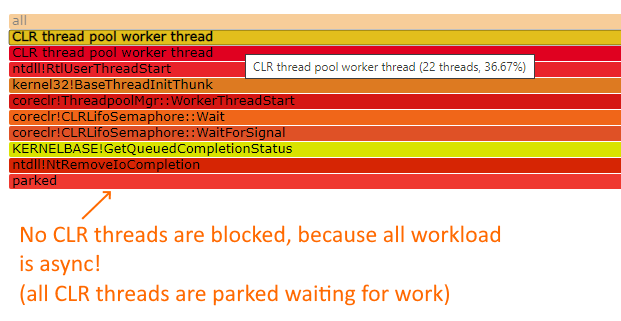
What separates an async hang from a traditional hang, is that it is caused by long-running or deadlocked asynchronous tasks. Because tasks are asynchronous, there are no blocked threads associated with them, and therefore we don’t know where the code is blocked!
Diagnosing async hangs with LeanSentry Hang diagnostics
We’ve recently added asynchronous hang analysis to LeanSentry Hang diagnostics. To learn how to find hang diagnosis reports in LeanSentry, see Identify website hangs in our LeanSentry Hang diagnostics guide.
When LeanSentry diagnoses a hang, it will also attempt to analyze the outstanding async tasks. It will then try to detect async tasks that appear to be blocking and thereby causing the hang:
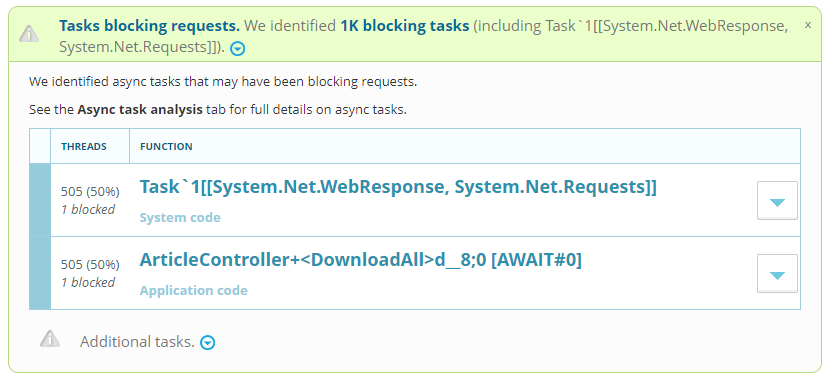
Even though an async task does not have a “stack trace” like a synchronously blocked thread does, LeanSentry attempts to obtain an async completion trace which helps identify the sequence of tasks that are waiting on the “blocked” task:
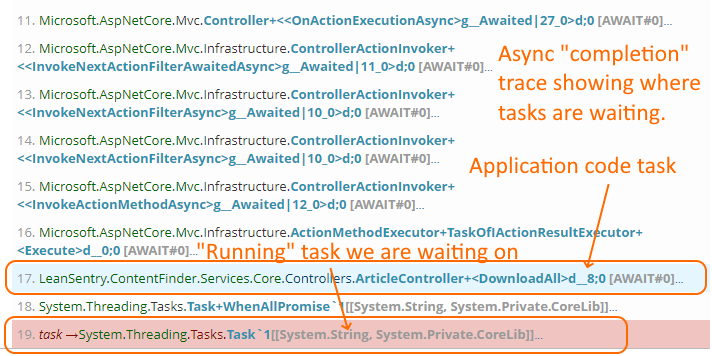
LeanSentry Hang diagnostics identify the “completion” trace for the blocked async tasks.
This completion trace helps you identify key information to find the blocked application code:
- The application level code that triggered the async operation.
- The task that you are waiting on.
Finding the application code awaiting the blocking async task
In the above example, the async code that we are waiting on is coming from the “ArticleController.DownloadAll” method.
Because a method may trigger multiple async operations, the 0-indexed AWAIT #0 tag helps us locate the specific await statement in the code:
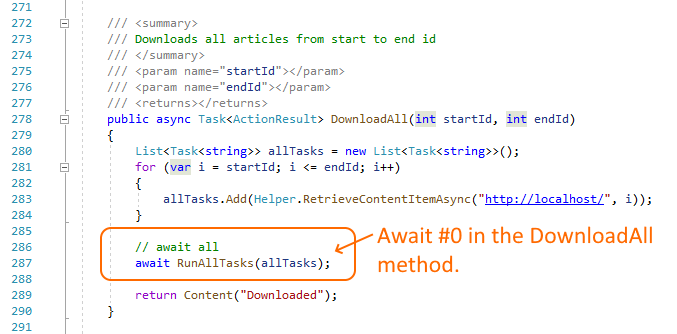
In other words, you can find the async operation the code is waiting on by finding the await statement in the method that correspondings to the AWAIT #N number shown in the stack trace.
Finding the blocking task being awaited
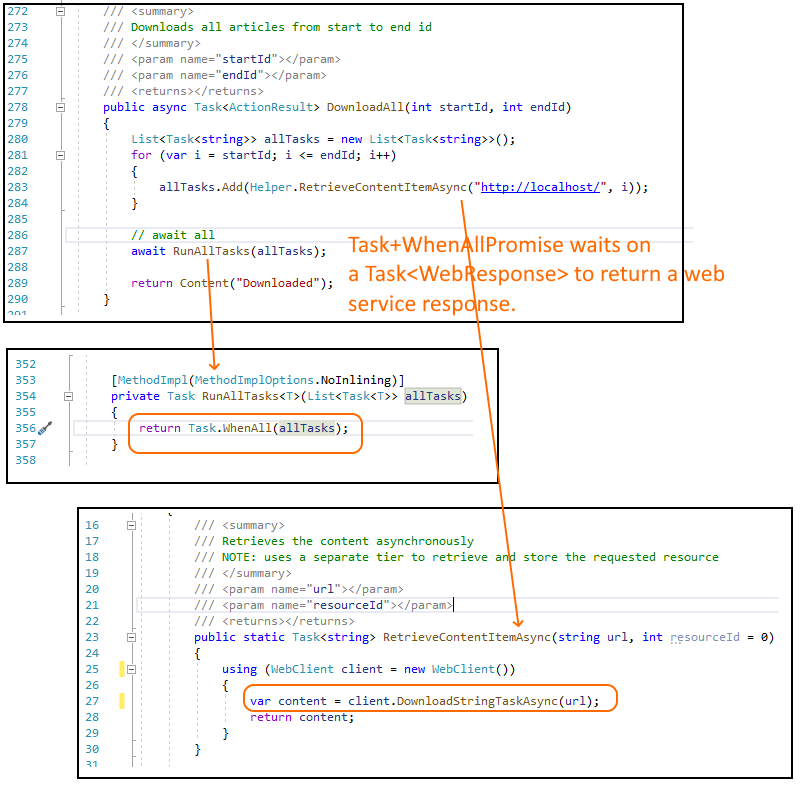
Because asynchronous applications can have very complex task chains, we may also need to know what actual part of the async operation we issued from OUR code is taking time to complete.
To determine this, we need to look at the last task in the completion stack trace. That is the actual task we are waiting on.
Chances are, this task will represent some internal operation deep in the .NET framework code, such as waiting for some network operation to complete. You’ll have to interpret it based on the task type and other tasks in the completion trace:
At times, you may be able to guess at what the operation is from other tasks that are waiting during the hang:
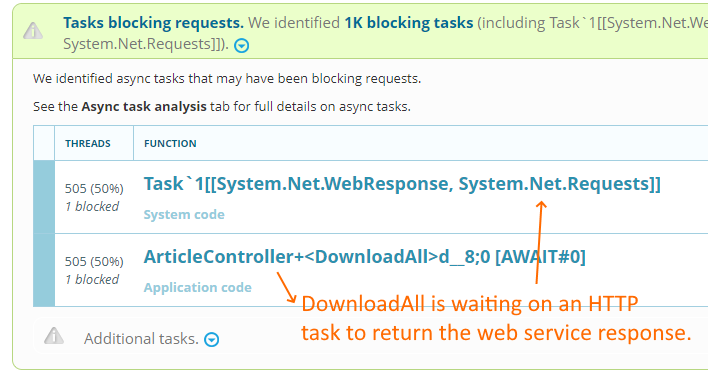
You can often do this by reviewing the operations that your application code is making, and making a logical inference based on the tasks present in large quantities in the hang analysis.
Exploring the async tasks during the hang
Just like you can visually explore the blocked threads during a regular hang, you can also explore the async task trees that are park of the async hang.
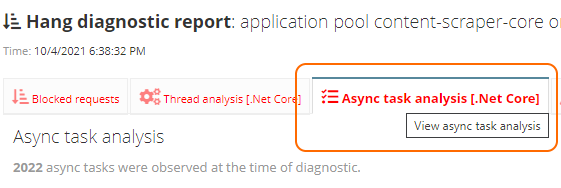
You can then drill into the task trees found during the hang:
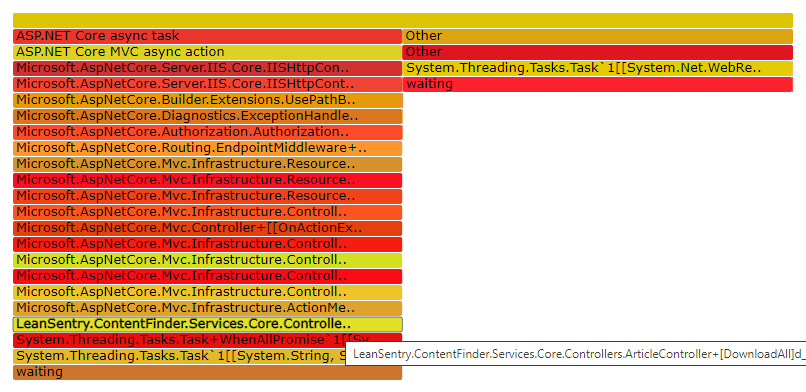
For more power, you can also use the task type and async task state filters to filter down to specific types of tasks.

Async task type and state filters in the table.
For example, you can filter to tasks that are:
- Started (tasks that have been scheduled for execution)
- Queued (waiting for a thread to execute, large numbers of tasks in this state signal thread pool exhaustion as the delaying factor).
- Running: tasks that are executing code synchronously on the CPU.
- Waiting: tasks that are blocked waiting for an async operation or another task.
- Request: tasks that are recognized as blocking a request.
(LeanSentry is able to determine these states better in .NET core applications, and will report less state information for legacy .NET framework applications due to inherent limitations.)
Conclusion
Hangs can be hard to troubleshoot in production.
Async hangs are even harder, due to the lack of stack traces associated with blocked threads in synchronous hangs.
You can use LeanSentry Hang diagnostics to help diagnose both sync and async hangs, using the new async/await analysis functionality.
For more information on troubleshooting production IIS and ASP.NET hangs, see LeanSentry Hang diagnostics.
