A super "task manager" for your entire environment!
Quickly identify websites and processes using resources across your entire environment in real-time, view performance detail, and diagnose them with a single click.
How to read the graph: The graph shows the top websites and processes by their CPU and memory usage. The color bands provide a visual guide between the lightest (<20% of maximum usage) to darkest (100% of maximum usage).
Getting information fast: Each website/process will show which diagnostics it has enabled and which have reports , and whether it has performance warnings . Click the label to view additional metrics and diagnostic details.

- Click the label to view and request diagnostics, and view performance details!
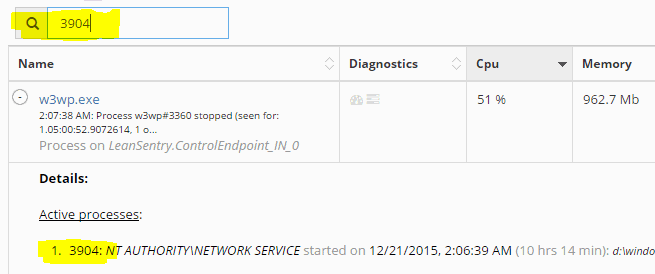
- Bring up the details panel by clicking the icon.
Quickly finding what you need
- Hover over a point to filter to all instances of the website/process (even those not shown by default). Click anywhere on the chart to go back.
- Click-drag to zoom the chart. Click the 'Reset zoom' button to go back.
- Search the table to automatically filter the chart. TIP: you can search by process/website name, PID, server name, or any performance tags!
Metrics and diagnostics
Click the website/process label on the graph to bring up its details. This includes additional metrics, performance warnings, and the applicable diagnostics.

From here, you can:
- Review performance warnings. We automatically generate warnings for many classic performance problems or whenever a process instance on one server has a significantly different performance from other instances.
- Request diagnostics. Click the "diagnose now" link to instantly request diagnostics.
- View and configure diagnostics. You can immediately view the most recent high quality diagnostic report. Click the button to configure diagnostic settings, and "view all" to view all diagnostic reports available.
Process history
The main interface focuses on showing you the *current* performance of your processes and websites.
Click the icon for each process to bring up its performance history.

Here you can:
- See the process' performance metrics over time.
- See the full event history for the process, including all the diagnostic reports.
- Search and filter the event history to find specific events and/or diagnostics.

TIP: Click-drag on the history chart to zoom events into a specific time period. Combine this with filtering to quickly find the events or diagnostics you need.
Got questions or comments?
Please email us - we are actively looking for feedback on this feature to help make it a slam dunk for your everyday operations.
You can also link directly to this article here.
More resources
Want to learn the best techniques for managing your IIS web server? Join our how-to newsletter.
Want to get the best tool for troubleshooting and tuning your web apps? Try LeanSentry free for 14 days.