If your CPU profiler encounters an error while profiling your production application, you may be able to use this technique to recover your process without killing it.
Summary
When profiling CPU in production, a failed CPU profiler can leave your production process unresponsive. You can use this technique to recover the process and continue operation.
Is CPU profiling in production a good idea?
In a perfect world, thorough load testing could happen entirely in your development or staging environment, helping you catch all the performance issues before your code hits your production environment.
Unfortunately, in the real world, this is almost never the case. Most performance problems and high resource consumption happens in production. As a result, you may find yourself needing to perform CPU profiling in production, using one of the many available Microsoft and thirty party profiling tools.
How do CPU profilers work?
There are many great CPU profiling tools available for .NET applications. Most of these tools use the CLR profiling APIs, a mechanism that allows the profiler to be injected into your application process, and intercept method calls within your application. This is the mechanism used by many industry leading profiling tools, including ANTs Profiler, New Relic, and so on.
Can the CPU profiler affect my production application?
Unfortunately, they can. Because the CLR profiling APIs introduce external code into your process, they can cause problems if the profiler experiences a bug or is unable to keep up with the operation of your application.
This can commonly manifest itself as:
- The process becomes very slow, because the CPU profiler itself is adding too much overhead.
- The process grows in memory usage until its not able to function, because the profiler is using too much memory to store data.
- The process crashes, due to a profiler fault.
- The process hangs, because the profiler itself has hung or failed to resume process threads.
Recovering a hung process after a failed CPU profiling attempt
NOTE: This technique applies to profiling attempts where the CPU Profiling tool has "hung" or crashed, without properly detaching from your process.
If the profiler you are using has suffered a problem, preventing you from gracefully detaching it from your production process, follow these steps:
- If the CPU profiler process is responding, always attempt to detach it first.
- If the CPU profiler is not responding, but your process is functional, let it be.
Tip: Unless the CPU profiler is consuming too many resources, or has hung your process, it may be safer to let it run while you disconnect your instance from incoming requests and can safely bring it down.
- Make sure the Windows Debugging tools are installed. If not, install them.
- KILL the CPU profiler application. Note that this MAY kill your process as well, in particuar if you used the CPU Profiler to start your process (as opposed to attaching to it later).
- Execute the following command:
ntsd -p PID -c "~*m;.detach;qq"
* Make sure ntsd.exe is in your path. It is typically installed in %ProgramFiles(x86)%\Windows Kits\8.1\Debuggers\x64 (64bit) or %ProgramFiles(x86)%\Windows Kits\8.1\Debuggers\x86 (32 bit)
* Replace PID with your process id.
The command given above attempts to resume the threads that may be suspended by the profiler. In some cases, this will resume the process after the profiler has been terminated.
Safer CPU profiling alternatives
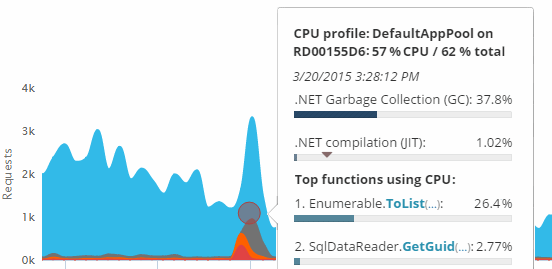
Some of the newer tools, including Visual Studio 2012 and LeanSentry, utilize a new non-invasive approach to CPU profiling that uses the Windows ETW Tracing events instead of the CLR Profiling APIs.
This type of CPU profiling is not dangerous because it does not attach or load any code into your process, and cannot crash/affect it. For this reason, Microsoft recommends the trace approach for CPU profiling going forward.
Conclusion
Profiling CPU in production is a common need.
If you are performing CPU profiling in production, be prepared for the possibility of profiling issues affecting the stability of your process. Armed with this technique, you may be able to recover your process if the profiler fails. Also, strongly consider non-attaching CPU profiling options to avoid potential risk to your production environment.
More resources
Want to learn the best techniques for managing your IIS web server? Join our how-to newsletter.
Want to get the best tool for troubleshooting and tuning your web apps? Try LeanSentry free for 14 days.