Many applications experience performance issues as a result of inefficient memory usage.
The most common production memory issues are:
- High memory usage causing a low memory/heavy paging condition on the server, resulting in severely degraded performance, request queueing, and in some cases the server VM becoming inaccessible.
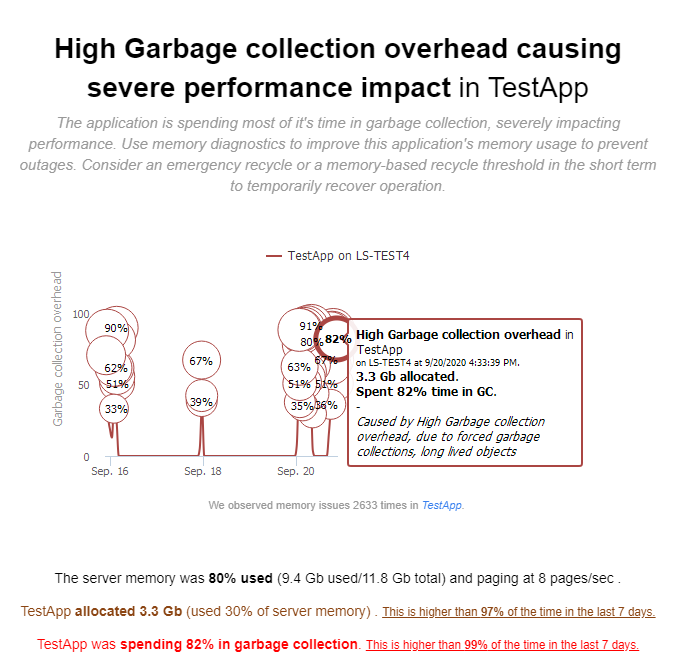
- .NET garbage collection overhead causing application performance degradation, due to processing pauses, and in some cases excessive CPU usage.
In many cases, heavy GC overhead can also increase the chance of hangs due to limited thread pool scaling. - Increased server costs, due to needing to provision for unnecessarily large application memory demands.
This is especially relevant for cloud-deployed applications with many instances or large memory footprint. In those cases, it is often possible to significantly reduce total hosting cost by reducing application memory usage.
LeanSentry automatically detects memory issues, notifies you about issues with significant impact, and can diagnose both .NET and native memory usage to help you resolve memory issues at the code level.
Memory issue notification
LeanSentry will alert you whenever it detects memory issues that affect your server or application performance.
For example, these notifications may include:
- Garbage collection impact that causes performance degradation.
- High memory usage that causes low server memory and performance degradation due to paging.
- Memory leaks and abrupt changes in memory usage or Garbage collection overhead.
Each notification will provide additional information about impact, link to the memory diagnostic report, and any available diagnostics.
How to discover memory issues
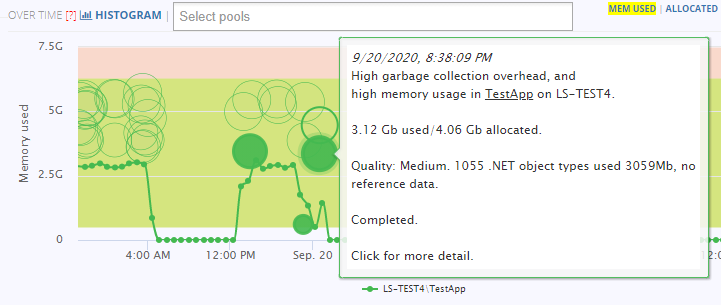
You can use the 'Memory diagnostics' tab for any website to review memory issues detected during the selected time period.
For more about discovering memory issues, see Find application memory leaks with LeanSentry.
How to diagnose memory issues
By default, LeanSentry detects but does not diagnose memory issues. You can enable automatic memory diagnostics or manually diagnose memory usage to determine the cause of memory issues down to the application level.
Once diagnosed, you can use the memory diagnostic reports to determine what caused the memory leak or Garbage collection overhead.
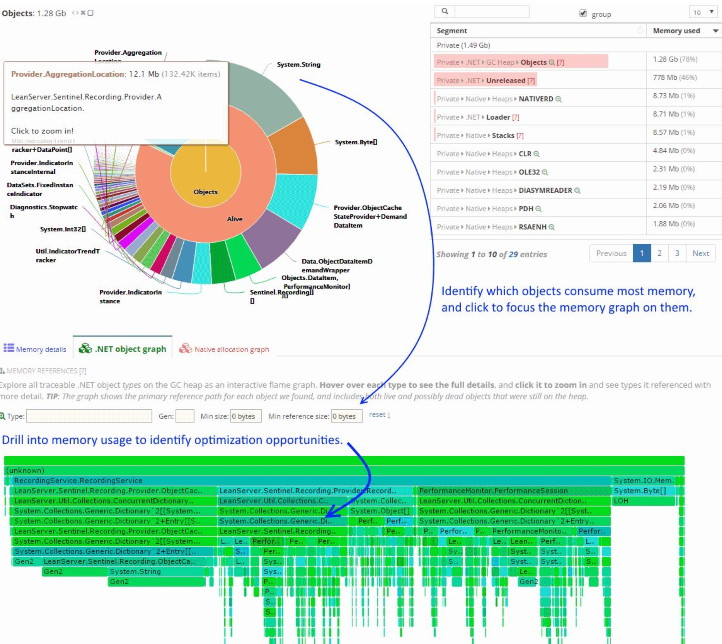
For an applied example of using the memory diagnostic reports to analyze memory usage, please see Determine the cause of a memory leak using LeanSentry's memory diagnostics and Resolve a memory leak using a LeanSentry memory diagnostic report.
Getting help with memory analysis and optimization
Some memory optimization may be more complex than others. The LeanSentry team routinely performs memory analysis and optimization across a wide variety of applications. However, some customers may find this process challenging.
If you would like assistance with memory optimization, please contact support.