Hang diagnostics
LeanSentry's Hang diagnostics help you stay in control of your website's performance by automatically troubleshooting IIS + ASP.NET performance problems. Hang diagnostics help you:- Resolve website outages, poor performance, and queueing.
- Troubleshoot slow requests.
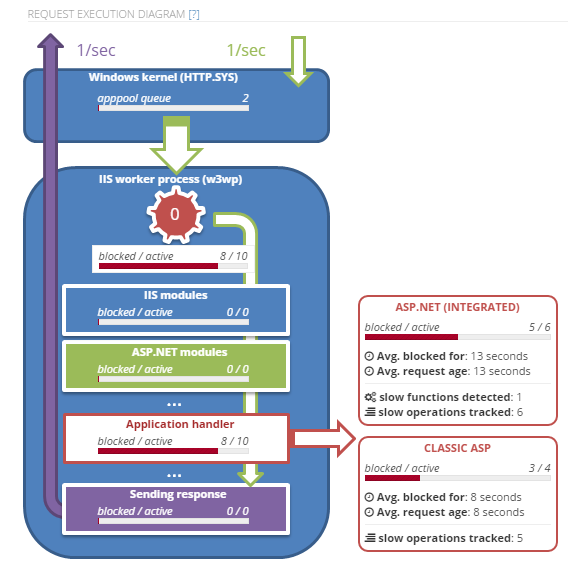 How it works
LeanSentry continuously monitors your websites for signs of common performance problems, with virtually no production overhead.
- When a problem is detected, LeanSentry confirms it with a lightweight analysis of active requests.
- If the hang is confirmed, LeanSentry performs a quick debugger-based analysis to diagnose the hang. This typically lasts 5-10 seconds.
- By default, once the analysis is complete, LeanSentry gracefully recycles your application pool to attempt to resolve the hang.
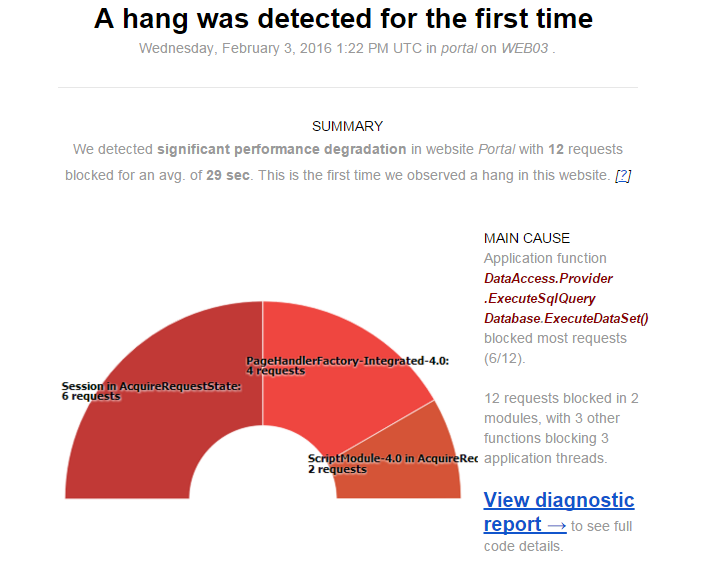 Using Hang diagnostic reports to resolve hangs
You can access Hang diagnostic reports from insight emails, from the main dashboard, or by going to the "Hang diagnostics" link in the diagnostics sidebar.
Each report breaks down the hang, and provides information on where requests were blocked as well as any other IIS and ASP.NET performance issues we identified.
1) The summary section will outline the key statistics and findings about the hang.
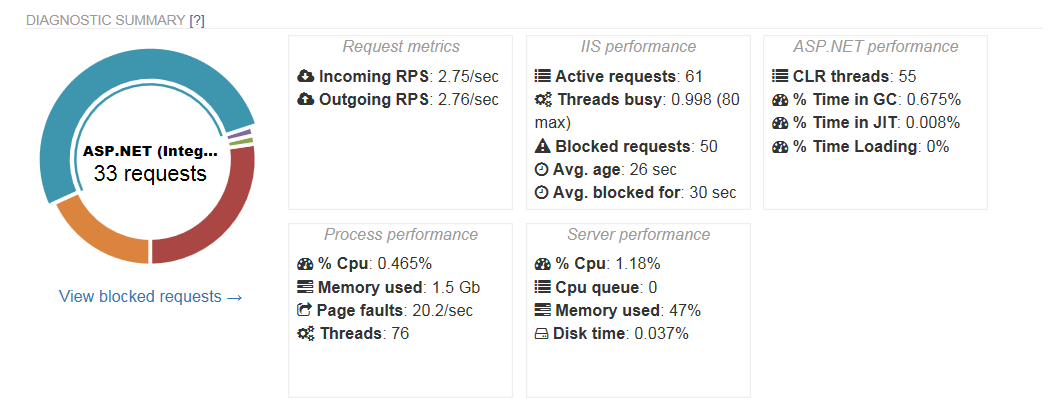 The findings will quickly explain what caused the hang, and list the relevant performance issues we detected. We'll detect and explain common problems such as concurrency limits, queueing, thread pool exhaustion, and so on.

TIP: LeanSentry inspects your configuration and the runtime conditions to identify dozens of performance problems.
2) Identify the application code causing the hang or request slowdowns.
Click the "Functions blocking requests" or "Functions blocking threads" findings to view the application functions causing the hang.
HINT: Expand each function to view the full stack details with source code information.
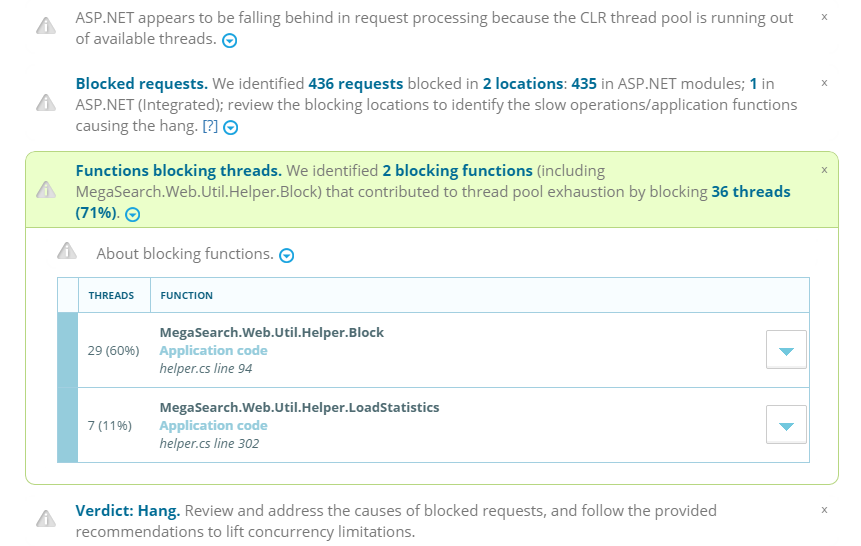 We'll also automatically display additional details where applicable, such as SQL query being made by a SQL call, file being accessed for file IO operations, or HTTP request being made by an HTTP request call.
3) Review the blocking locations, and associated application functions
Click the "Blocked requests" tab to view the blocked requests grouped by blocking location within your application's request processing pipeline.
Expand each location to view the application functions causing the blocking (if available).
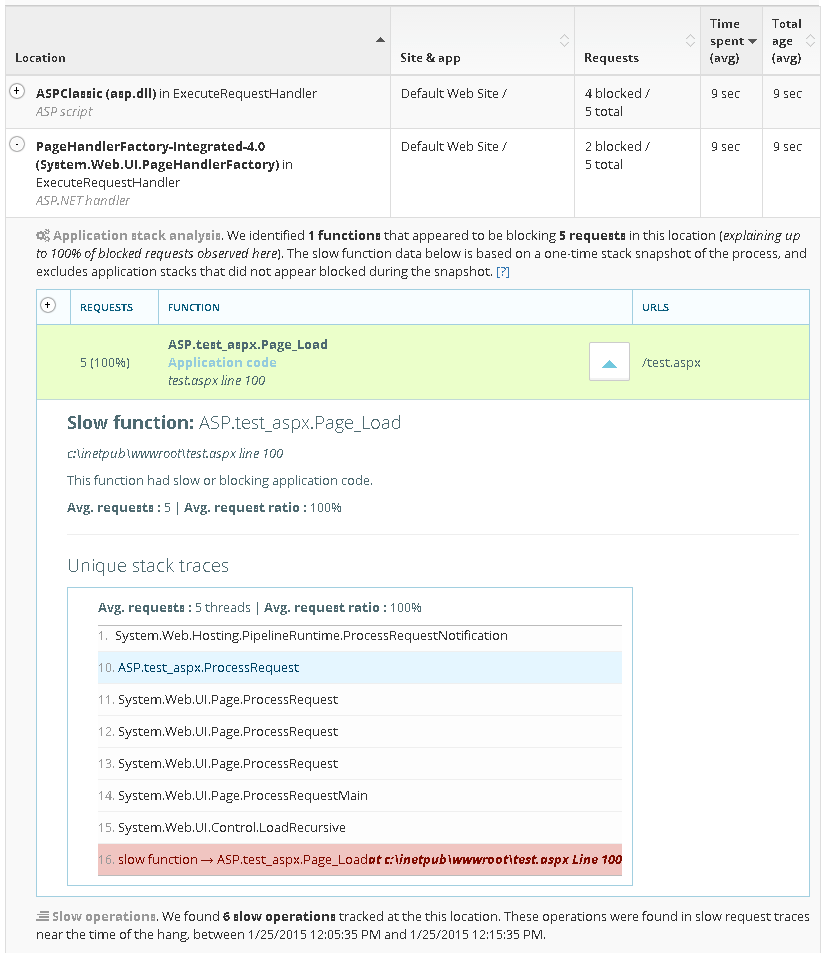 You can also view the requests themselves blocked in each location by clicking "Show requests" at the bottom of the tab.
Configuring Hang diagnostics
You can enable and configure Hang diagnostics for your entire environment, or for a specific website. Click the "Hang diagnostics" link in the main dashboard's "Diagnostics" sidebar to view the environment level-settings, or chose the website on that page to configure the specific site.
There, you can configure:
- Minimum thresholds for diagnostics, in terms of the minimum # or % of blocked requests necessary to trigger the diagnostic - and how long they must be blocked for.
- Limits on how often a diagnostic can run.
- Diagnostic mode: whether we perform the full analysis, or a lightweight analysis only (no debugger/recycle, but often sufficient esp. for non-ASP.NET applications) .
TIP: You can use Hang diagnostics to troubleshoot slow requests without a site-wide hang. To do this, consider lowering the minimum blocked request thresholds and focusing the diagnostic on a specific url (IMPORTANT: keep limits low to avoid too many diagnostic attempts).
NOTE: On-demand diagnostics can produce mixed results when triggered during a time when a hang is not taking place. It is better to let LeanSentry determine when a hang is taking place and automatically generate a diagnostic at that time.
Need help?
Have a question or feedback on Hang diagnostics? Email us at support@leansentry.com.More resources
Want to learn the best techniques for managing your IIS web server? Join our how-to newsletter.
Want to get the best tool for troubleshooting and tuning your web apps? Try LeanSentry free for 14 days.